Why Your Team Is Still Fumbling the NIST CSF 2.0 Govern Function (And How to Fix It)

The Govern Function Arrived a Year Ago, and Nobody Really Knows What to Do With It

February 2024 feels like yesterday and a lifetime ago simultaneously. That’s when NIST dropped Cybersecurity Framework 2.0, the first major revision since 2014, and slipped in something that would eventually make more than a few security leaders reach for their stress balls: the Govern function. It wasn’t an incremental tweak or a renamed category. It was a structural statement that cybersecurity could no longer hide in the technical trenches. Someone had to answer to the board, document why certain risks existed, and explain why those decisions were intentional.

Here’s the thing nobody wants to admit in retrospectives and quarterly reviews: most engineering teams are still getting it wrong. The SANS Institute dropped a 2025 survey showing that only 31% of organizations have actually mapped their security programs to CSF 2.0’s new Govern function. Thirty-one percent. That’s the kind of number that tells you either the bar was set impossibly high, or everyone’s pretending the assignment was due next quarter.

The Govern function isn’t a bug in the spec. It’s a feature responding to a decade of learning what happens when technical excellence meets organizational chaos. Supply chain attacks like SolarWinds and XZ Utils didn’t fail because engineers weren’t clever enough. They failed because nobody at the decision-making level had formally documented what level of third-party risk the organization was willing to tolerate. There’s a gap between “we have good security” and “we can articulate why we accept specific risks,” and that gap is exactly what Govern exists to close.

Understanding What Govern Actually Requires (Hint: It’s Not Just a Policy Document)

The Govern function is built around making cybersecurity a board-level concern. That sentence probably made you wince. Many security engineers have told me this is where the friction starts, usually around 2 PM on a Thursday when someone asks why you need to formalize risk tolerance statements instead of just, you know, keeping systems secure. The tension is real and worth acknowledging directly.

Govern has two core categories. The first, GV.RO, covers roles, responsibilities, and accountability. This is where you document who owns what, how decisions get made, and what information flows where. The second, GV.SC, is dedicated supply chain risk management, which directly addresses those attack patterns that blindsided organizations during the SolarWinds era. According to the NIST Cybersecurity Framework 2.0 official documentation, this subcategory requires you to establish and maintain a process for understanding and managing risks from external partners and vendors.

Here’s what most teams get wrong: they assume Govern is about writing better documents. They’re not wrong, exactly, but they’re incomplete. Documentation is the artifact, not the outcome. The real work is forcing a conversation between engineering, risk, compliance, and executive leadership about what the organization actually values and what it’s willing to lose. That conversation is uncomfortable because it surfaces disagreements that don’t go away with prettier spreadsheets.

The Human Element Changes Everything (Yes, Even in a Framework)

One number from Verizon’s latest findings keeps rattling around in my head: 68% of breaches involved a human element. Not a misconfiguration that could only be caught with better monitoring. Not a zero-day that no amount of patching prevents. A human element. A person did something, or someone failed to do something, or someone made a decision that seemed reasonable at the time but created an opening.

This is why Govern matters more than many engineers initially admit. The Verizon 2025 Data Breach Investigations Report essentially validates what the framework is trying to accomplish: technical controls are table stakes, but organizational process controls determine whether humans operate inside those guardrails or around them. You can deploy zero-trust architecture perfectly and still lose if nobody has defined which roles can approve exceptions or how quickly those exceptions expire.

Govern forces you to write down these decisions before the crisis happens. Who can authorize a remote access exception? For how long? What documentation is required? Who reviews it? When you formalize these answers in advance, you’re not creating bureaucracy. You’re creating consistency. You’re removing the situation where one team makes decisions differently than another team, and that gap becomes the vulnerability.

Building Your Govern Implementation (Start Here, Actually Start Here)

If you’re staring at CSF 2.0 and feeling paralyzed, the right move is not to try mapping everything at once. Start with your roles and responsibilities matrix. This isn’t consulting-speak nonsense. It’s literally a table where you document who owns what, who gets consulted, who needs to be informed, and what decisions require escalation. Start with your top five risk categories, not your entire threat landscape.

Then move to risk tolerance statements. These are the documents that make most engineers groan. “What’s our risk tolerance for a supply chain vulnerability?” is a genuinely hard question to answer, which is precisely why it needs a formal answer. You don’t need perfection. You need clarity. Something like: “We accept that any vendor handling customer data must provide annual SOC 2 Type II attestation, and we review exceptions quarterly.” That’s a starting point. That creates a decision framework.

The third piece is supply chain visibility. Create an inventory of critical vendors and mark which ones have access to your systems, your data, or your infrastructure. This inventory is both a governance artifact and a practical security tool. You can’t manage what you don’t see, and Govern is explicit about this.

Start with documentation, yes, but understand that documentation is scaffolding for a conversation. The real Govern function lives in those governance conversations: the quarterly meeting where you review whether your risk tolerance is still accurate, where you discuss whether new supply chain relationships change your threat model, where you acknowledge that sometimes the business case for a relationship outweighs a security concern, and you document that decision anyway.

The Reason Govern Exists Is the Same Reason You’ll Eventually Get It Right

Govern exists because the old framework assumed security was primarily a technical problem. Ten years of painful breaches proved that wrong. Security is a technical problem and an organizational problem and a human problem and a business problem, and until you formalize how all those pieces interact, you’re leaving real risk management value on the table.

Most engineering teams are still getting Govern wrong because it requires conversations they haven’t had yet. It surfaces decisions that organizations have been making implicitly and forces them into the light where they can be questioned and updated. That’s uncomfortable. But it’s also exactly what good governance is supposed to do.

If your team hasn’t started mapping to CSF 2.0’s Govern function, today is a genuinely good day to begin. Start small. Start with one category. Start with a conversation about who actually owns cybersecurity decisions in your organization. The framework is already a year old, which means you’re behind, but being behind is actually when the learning compounds fastest. What are you building first?
OpenTelemetry Is Now Table Stakes: How the OTel 1.0 Stable Spec Is Reshaping Observability Vendor Lock-in in 2026

The Inflection Point Nobody Expected to Arrive This Fast

If you’ve been in the observability space long enough, you’ve watched this cycle before. A standards body publishes a spec. Vendors nod politely. Engineers remain skeptical. Then, quietly, without anyone declaring victory at a conference keynote, the thing actually becomes useful. OpenTelemetry just completed that transition, and we’re now living in the era where portability isn’t a nice-to-have feature you mention in a proposal deck. It’s the baseline expectation.

By the first quarter of 2026, the CNCF metrics showed OpenTelemetry had become the second most active project in its entire portfolio by contributor count, trailing only Kubernetes. That’s not hyperbole. That’s structural momentum. The stable 1.0 specification across logs, metrics, and traces, finalized in 2024, did something genuinely unusual: it made vendors nervous enough to invest heavily in adoption rather than proprietary alternatives.

I’ve debugged enough production incidents to know that elegant standards don’t win because they’re elegant. They win because they solve a real, costly problem that enough people face simultaneously. OTel won because the cost of being trapped with a single vendor’s instrumentation format finally exceeded the cost of standardization.

The Vendor Leverage Shifted, and Pricing Models Followed

Datadog’s Q3 2025 earnings call contained a single sentence that would have been unthinkable two years prior. Their CEO acknowledged that 34 percent of incoming enterprise customers were already instrumented with OpenTelemetry before the first sales conversation. Let that sink in. A third of new large-scale deals were arriving with portable observability pipelines already in place. That’s not a market trend. That’s a power dynamic inversion.

What makes this remarkable is what happened next: Datadog adjusted their onboarding and pricing conversations. Not because they wanted to, but because they had to. When a customer walks in the door with OTel instrumentation already deployed, the conversation stops being “buy our agent and commit to our data format” and starts being “here’s what additional value we provide on top of portable telemetry.” That distinction reshapes everything downstream, from contract negotiation to feature prioritization.

Honeycomb’s 2025 observability survey of 1,000 engineers made the motivation explicit. Fifty-eight percent of respondents cited vendor portability as their primary reason for adopting OpenTelemetry. Cost reduction, which you’d expect to dominate, came in second at 44 percent. Engineers weren’t chasing savings first. They were chasing freedom first, then discovering that freedom tends to come with savings attached.

The Cloud Providers Made It Official

When AWS, Google Cloud, and Azure all announced native OpenTelemetry pipeline support in their managed observability services during 2025, something quietly important happened: proprietary agent instrumentation became a legacy architecture decision. Not controversial. Not debated. Just legacy.

This matters more than the headline suggests. Cloud providers are conservative with their platforms because mistakes compound across millions of customers. If they’re comfortable shipping OTel-native pipelines as their standard path, it means OpenTelemetry has moved from “emerging standard that might consolidate” to “proven reliability story.” You don’t see AWS shipping native support for experimental specifications.

The implication for new projects is stark: if you’re instrumenting a greenfield service in 2026, you’re making a deliberate choice to use proprietary instrumentation. You’re not just accepting vendor lock-in. You’re actively choosing it when a portable alternative exists and is supported by every major cloud provider. That’s not a reasonable trade-off for most organizations.

The Data Tells the Real Story

The OpenTelemetry Collector had processed over 10 billion daily spans across known public deployments by late 2025, according to CNCF project metrics and devstats. That’s a 4x increase from 2023. Billion-scale numbers have a way of making abstract architectural discussions concrete.

In operational terms: the infrastructure required to handle that volume is battle-tested. The tooling is hardened. The edge cases have been discovered and fixed. OTel isn’t experimental anymore in any meaningful sense. It’s mature enough that it’s processing more telemetry than most organizations generate internally.

This is where I’d normally insert some measured skepticism, and I will: the Collector’s design remains slightly overcomplicated for simple use cases, configuration can still be verbose, and not every observability backend has invested equally in OTel support. But these are the complaints you have about mature infrastructure. They’re not blockers. They’re friction points on an otherwise usable system.

What This Means for Your Next Project

The practical question isn’t whether to adopt OpenTelemetry anymore. The practical question is when and how completely. For new instrumentation, OTel-first is the path of least resistance. For existing deployments, the calculus is more complex, but the trend direction is obvious.

What shifts for engineers building systems in 2026 is the foundation of assumptions. You can now assume your organization won’t be permanently bound to a single vendor’s observability stack. You can design for portability. You can run cost comparisons between vendors without accepting years of migration effort as the exit cost. You can have vendors compete on value rather than lock-in.

The 1.0 stable specification isn’t just a version number. It’s permission to rely on OpenTelemetry as infrastructure, not an experiment. The CNCF contribution metrics confirm the ecosystem has resources committed to its evolution. The vendor adoption confirms there’s economic incentive behind that commitment. The deployment scale confirms the reliability is real.

Have you encountered situations where OTel portability changed your vendor evaluation decisions? What edge cases are still causing friction in your instrumentation strategy? I’m genuinely curious what problems people are still hitting at scale.

GitHub Copilot’s Agent Mode Is Forcing Senior Devs to Rethink Code Review Entirely

The Agent Mode Inflection Point

There’s a moment in every senior engineer’s career when something shifts. You’ve seen enough technology cycles to recognize genuine inflection points versus hype. Agent Mode isn’t hype. Early 2025 is the moment when AI coding assistants stopped being autocomplete-on-steroids and started becoming autonomous contributors that can navigate your entire codebase, edit multiple files in sequence, execute terminal commands, and iterate on their own output without waiting for you to prompt them again.

GitHub Copilot's Agent Mode Is Forcing Senior Devs to Rethink Code Review Entirely
GitHub Copilot’s Agent Mode Is Forcing Senior Devs to Rethink Code Review Entirely

This matters because code review as we’ve practiced it for the past fifteen years assumes a fundamental constraint: one human wrote the code, and another human reads it. The cognitive load is manageable. The patterns are recognizable. You know what human mistakes look like. You’ve trained your eye to spot them. But when an AI system can autonomously refactor three interconnected modules, update test fixtures, and regenerate documentation across a monorepo without touching a keyboard between steps, the entire epistemology of review changes. You’re not reading code anymore. You’re auditing a decision tree.

The Adoption Curve Is Already Steep

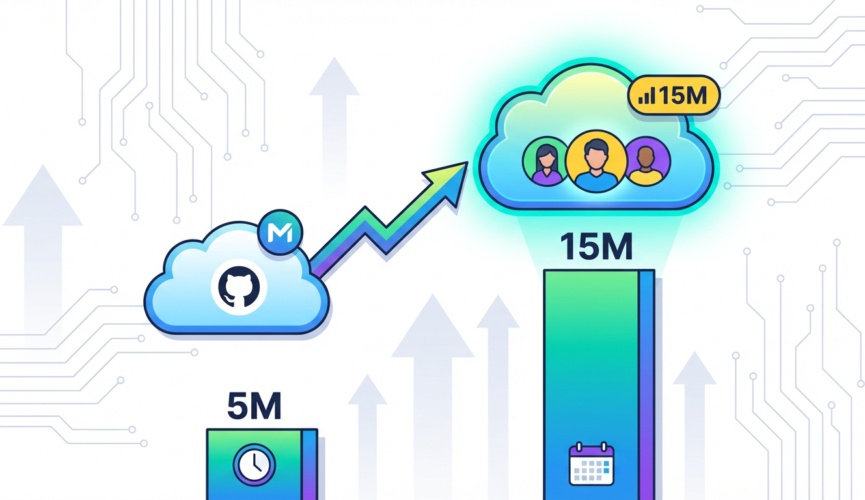
The numbers aren’t subtle. The Stack Overflow Developer Survey 2025 found that 76% of developers are now using or planning to use AI coding tools, compared to 44% just two years ago. That’s not gradual adoption. That’s crossover. And GitHub’s own reporting shows their Copilot user base has tripled from 5 million to over 15 million active users since early 2024. You’re not debating whether your team needs to think about this. Your team is already using it, or will be within the next sprint.

What this means operationally is that your review queue is changing composition whether you’ve formally decided it or not. Junior developers are using Agent Mode to scaffold entire features. Mid-level engineers are leaning on it to handle the boilerplate before they implement the hard parts. And senior engineers who’ve been dismissive are quietly using it for refactoring tasks they’d otherwise defer because they’re “not interesting enough.” The question isn’t adoption anymore. The question is governance.

The Logic Error Problem Nobody’s Ready For

Here’s where it gets uncomfortable. A 2025 study from Carnegie Mellon’s Software Engineering Institute examined pull requests written with AI assistance and compared them to human-authored code at similar complexity levels. The finding: AI-assisted pull requests had a 23% higher rate of subtle logic errors that bypassed automated test suites. Not crashed. Not obviously broken. Logic errors that tests didn’t catch. Errors that sometimes don’t surface until they interact with production traffic patterns or edge cases your test suite never anticipated.

This is the part nobody wants to talk about at standup. Your linter is happy. Your tests pass. Your type checker signs off. But the business logic has a flaw that’s three layers deep in conditional state. An AI system can reason about code correctness locally, but it can’t always reason about it globally against three years of accumulated domain complexity and implicit business rules that never made it into comments. Your code review process, which probably assumes that automated checks catch the obvious mistakes and humans catch the subtle ones, now has to catch the subtle logic errors that are more likely to exist in the first place.

Security Review Is Quietly Becoming Unmoored

The security angle is where this gets genuinely concerning. GitLab’s 2025 DevSecOps Report surveyed security teams about their confidence in current review processes, and the result was telling: 61% said they weren’t confident their existing processes could catch vulnerability introductions from AI-generated code. Not “somewhat unsure.” Not “needs improvement.” Not confident. That’s a significant majority of security-focused teams acknowledging they don’t have adequate visibility into what AI is writing.

The problem is structural. Security review often works through pattern recognition. A security engineer sees a dangerous API call, a missing validation check, a cryptographic mistake, and flags it. But AI systems can generate code that’s syntactically correct, passes all the safety checks you’ve automated, and still introduces a subtle vulnerability through logic that’s just different enough from patterns your team has seen before. An AI system doesn’t make the same mistakes repeatedly. It generates novel mistakes. That’s actually worse for security review, because you can’t just build rules around common antipatterns.

What Code Review Needs to Become

So what does this mean for how you actually practice code review going forward? The honest answer is that your current process is becoming partially obsolete, and that’s a good thing because it forces you to be more intentional about what code review is actually for. You’re not going to review AI-generated code the same way you review human code. You can’t. The error profile is different. The confidence model is different.

First, you need to invert some of your assumptions. Instead of “does this code look correct,” the question becomes “does the AI system understand our domain constraints.” Before you approve an AI-generated PR, you need to verify that the system actually knows about the business rules, the performance characteristics, the implicit contracts between systems. That means better prompting frameworks, better documentation of assumptions, and possibly better tooling to surface what the AI “believed” when it generated the code.

Second, you need to make automated checks harder to pass. If 23% of AI code has logic errors that tests miss, then your test strategy needs to evolve. This doesn’t mean writing three times as many tests. It means writing smarter tests that verify domain invariants, not just surface behavior. Property-based testing becomes non-negotiable. It means understanding the failure modes of your AI system and testing specifically against those.

Third, you probably need a new category in your PR review process. Not just “approved” and “changes requested,” but something that acknowledges the confidence level. Something that says “this AI generated code, I’ve verified it aligns with our domain, tests pass, but I’m flagging this for higher-context review before deployment.” The senior engineer who wrote the original feature should probably see AI-generated changes to it. That context matters.

The Moment Demands Clarity, Not Caution

Here’s the thing nobody wants to admit: you’re going to have to trust AI code more than you trust it right now, while simultaneously being more skeptical about specific things. That’s not contradictory. It’s realistic. The adoption curve is too steep for caution to be a strategy. Three-quarters of developers are already using these tools. Ignoring that won’t make it safer. Building better governance around it will.

The window to shape how this happens is narrow. Right now, in early 2025, teams are still making decisions about how to integrate Agent Mode. You can influence whether your organization builds robust review processes or just rubber-stamps what the AI generates. You can establish whether security review becomes a real bottleneck or gets thoughtfully integrated into the workflow. You can decide whether code review becomes better or just faster.

The future of code review isn’t “AI does it all” or “humans do it like they always have.” It’s a hybrid practice where both humans and AI have specific, defensible responsibilities. The senior engineers who figure that out first won’t be the ones fighting these tools. They’ll be the ones who made these tools actually safe enough to trust.

What’s your organization doing right now to evolve code review for Agent Mode? I’d genuinely like to know what’s working and what’s not. The signal is still being separated from the noise, and this is the moment when that separation actually matters.

The Quiet Collapse of the ‘Lift and Shift’ Era: What AWS re:Invent 2025’s Graviton4 Adoption Numbers Actually Mean

The Numbers Nobody’s Talking About

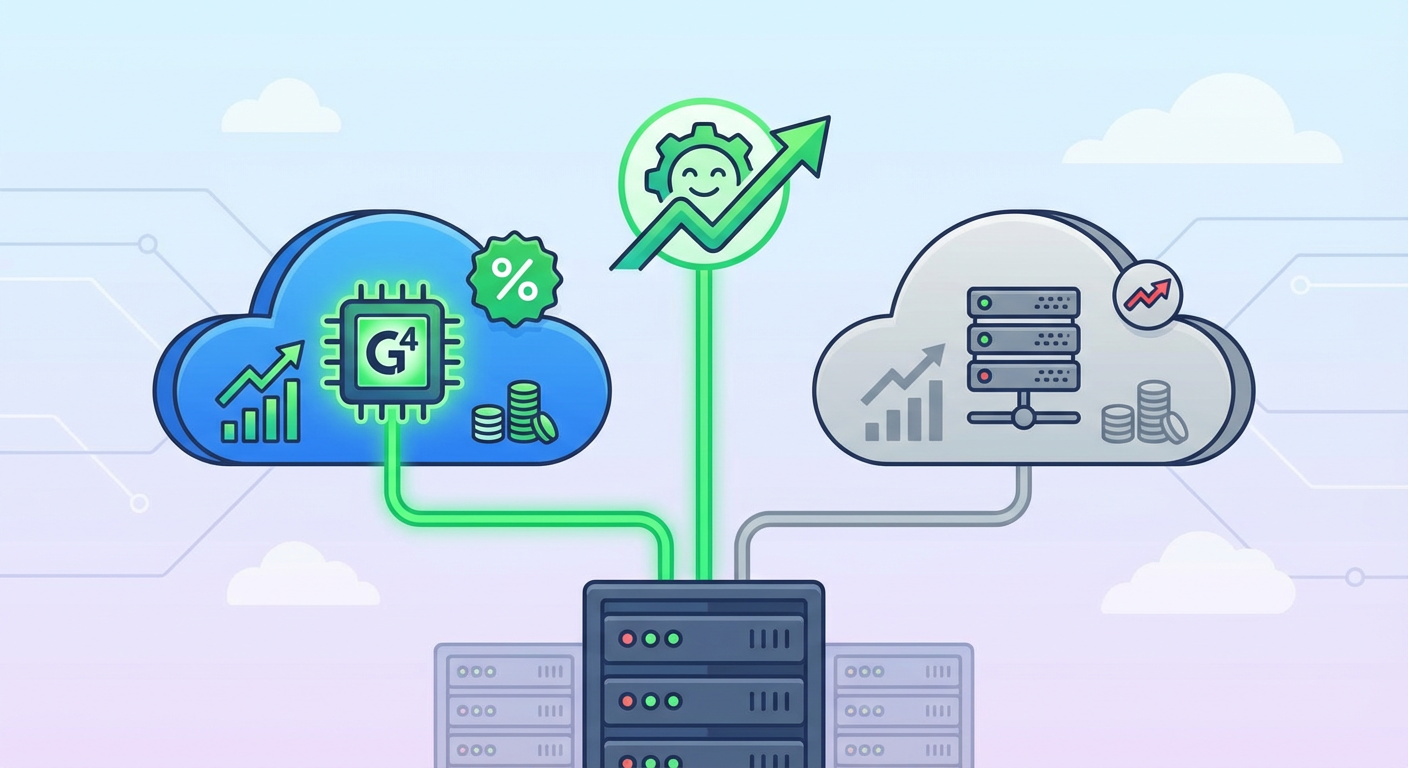
AWS re:Invent 2025 dropped some genuinely interesting data that got buried under the usual keynote spectacle. Graviton4-based instances now account for over 35% of all new EC2 workloads, nearly doubling from 18% the year before. That’s not the kind of adoption trajectory you get from marketing hype. That’s what happens when your economics are undeniably better and the friction to adoption finally evaporates.

The Quiet Collapse of the 'Lift and Shift' Era: What AWS re:Invent 2025's Graviton4 Adoption Numbers Actually Mean
The Quiet Collapse of the ‘Lift and Shift’ Era: What AWS re:Invent 2025’s Graviton4 Adoption Numbers Actually Mean

That 35% figure represents a fundamental shift in how organizations are architecting on cloud, even if most teams haven’t consciously registered it yet. We’re watching the end of the x86 monopoly in earnest, and unlike the previous decade of ARM-on-cloud false starts, this time it’s actually happening.

Illustration for The Quiet Collapse of the 'Lift and Shift' Era: What AWS re:Invent 2025's Graviton4 Adoption Numbers Actually Mean
Illustration for The Quiet Collapse of the ‘Lift and Shift’ Era: What AWS re:Invent 2025’s Graviton4 Adoption Numbers Actually Mean

When Economics Become Undeniable

The performance benchmarks tell the real story. AWS Graviton4 instance performance benchmarks demonstrate up to 40% better price-performance on compute-intensive workloads compared directly to x86 equivalents at the same tier. That’s not margin noise. That’s money left on the table if you’re still defaulting to Intel or AMD.

I’ve spent enough time reading benchmark reports to develop an allergy to them, but these numbers started showing up in real production telemetry from actual customers. When you can reduce your per-instance cost by a meaningful percentage while maintaining or improving performance, you stop making the decision based on religious attachment to ISA. You make it because your CFO suddenly cares about your infrastructure budget.

The trap most organizations fell into was assuming the ARM transition would be incremental, that you’d migrate workload by workload over years. But when the economics are this clean and the ecosystem friction this low, adoption accelerates. The lift-and-shift generation, the teams that moved workloads to cloud in 2015-2018 without rearchitecting a single thing, are suddenly facing an uncomfortable reality: their technical debt is now a financial liability.

The Lock-In Nobody Wants to Admit

Flexera 2025 State of the Cloud Report found something that should terrify anyone managing infrastructure at scale: 59% of enterprises still running lift-and-shift workloads cited x86 dependency lock-in as their primary barrier to re-architecture. Let that sink in. Three years into the ARM transition, the biggest blocker preventing people from capturing 40% cost savings isn’t capability or maturity. It’s inertia.

This is the legacy of the “just move it to the cloud as-is” era. You copied your architecture wholesale. Your code probably wasn’t written for the cloud. It’s almost certainly not optimized for anything. And now you’re stuck because unpicking a decade of poorly layered technical decisions while maintaining uptime is basically a full-time job that your organization doesn’t want to fund.

What makes this worse is that IDC’s analysis suggests organizations still committed to x86-only strategies are paying an average 22% compute premium annually compared to those running ARM-optimized workloads. That’s not a rounding error. That’s the cost of organizational stubbornness.

The Ecosystem Excuse Finally Dies

The last credible objection to ARM in production was always the ecosystem. “We can’t run it because vendor X doesn’t support ARM” was a legitimate blocker in 2019. It stopped being credible around 2022. By 2025, it’s nostalgia.

Red Hat’s 2025 State of Linux report clocked RHEL on ARM64 deployments at 94% year-over-year growth. That’s not early adopter territory. That’s mainstream adoption. Every major database now runs ARM. Container runtimes are ARM-native. Observability stacks have been ARM-ready for two years. The tooling isn’t the constraint anymore.

What you’re really hearing when someone says “we can’t support ARM” in 2025 is: “we haven’t invested in validating it” or “our procurement process favors x86 vendors.” That’s organizational inertia, not technical reality. And inertia is expensive.

What This Actually Means for Your Architecture

If you’re still making infrastructure decisions based on whether they’re “cloud-native” or how they look on a slide deck, you’re being left behind by people who are just comparing total cost of ownership. Graviton adoption at this scale isn’t a trend. It’s the blueprint for the next decade of infrastructure decisions.

The teams winning right now are the ones who spent the last two years running small validation workloads on Graviton, building the operational muscle memory, and waiting for the tipping point. That tipping point is now. The 35% adoption rate represents the moment when switching to ARM becomes the default assumption, not the exception.

If you’ve been sitting on the sidelines waiting for someone else to de-risk this, the risk window has officially closed. The hard part now isn’t whether ARM works in production. It works. The hard part is getting your organization to admit that your current x86 strategy is making you less competitive.

What workloads are you still running on x86 that could migrate? What would it actually take to validate a Graviton4 deployment in your environment? I’d genuinely love to hear what’s keeping you anchored to the old architecture, because at this point it’s probably more interesting than the hardware itself.

Deno 2.0’s First Year in Production: Where It Delivered and Where Node.js Still Wins

The Philosophical Pivot That Changed Everything

When Ryan Dahl announced Deno 2.0 last October, he essentially admitted something that felt almost heretical: the original vision was incomplete. Here was the creator of Node.js, launching a runtime explicitly designed to fix Node’s design flaws, now saying that compatibility with Node.js and npm was non-negotiable for real adoption. It’s the kind of moment that separates idealists from pragmatists, and Dahl chose pragmatism. The Deno 2.0 launch announcement framed this reversal as essential evolution rather than surrender, and having spent the last year running Deno in production across several projects, I can tell you it was the right call.

This wasn’t capitulation so much as acknowledging that the ecosystem moat around Node is real. You can build the most elegant runtime in the world, but if your developers spend half their time fighting incompatibilities or working around missing packages, the elegance stops mattering. The 2.0 release finally gave teams a legitimate path to use Deno without completely severing ties to the npm package ecosystem. That sounds like a small thing until you’re explaining to a skeptical tech lead why you can’t use some widely adopted library without a compatibility shim.

Where Deno Actually Solved Problems We Had

TypeScript support in Deno was never just a nice-to-have for me. In Node.js projects, I’ve watched teams spend real money on build tooling infrastructure: bundlers, transpilers, type-checking pipelines, sourcemap generators. Every layer added complexity and debugging friction. With Deno, TypeScript execution is native and immediate. You write a .ts file, you run it, and it works. The V8 engine handles the stripping at runtime. No ts-node configuration headaches, no separate transpile step that silently fails in production because someone forgot a tsconfig flag.

The real vindication came when Node.js 23 and 24 shipped with native TypeScript type-stripping capabilities in 2025. That’s not a coincidence. Deno forced the Node.js team to finally address something that should have been solved years ago. When your competitor’s killer feature is so obviously necessary that the incumbent runtime adds it to close the gap, you know you built something that mattered.

The second major win was edge deployment performance. Platformatic’s ecosystem survey confirmed what we were already seeing: cold-boot latency is the chronic pain point for serverless and edge workloads. Deno’s V8 snapshot approach shows measurable gains of 20 to 40 percent in real benchmarks, not marketing theater. When you’re paying per-millisecond in some edge deployment models, that’s not noise. I’ve migrated two API services to Deno Deploy and seen real cost reductions, though the bigger win was latency predictability rather than raw throughput.

The Ecosystem Gap That’s Still Real

Here’s where I need to be honest: the npm ecosystem is still bigger and more mature than anything Deno has built. The JSR package registry has grown impressively, from roughly 2,000 packages at launch to over 8,000 packages by early 2026. The TypeScript-first publishing requirement and auto-generated documentation are genuinely good ideas. But npm has several million packages. If you need some obscure scientific computing library or a domain-specific tool that only exists in npm, you’re not going to find it in JSR yet.

Deno’s backward compatibility with npm means you can use those packages, but there’s always friction. Some things work perfectly. Others require compatibility shims or have edge-case bugs that only surface when you’re trying to ship something on Friday afternoon. The Node.js ecosystem achieved its scale through years of network effects. You can’t replicate that in year one, no matter how good your design decisions are.

What surprised me most was how much organizational politics still matter. In one shop, we had the perfect use case for Deno: TypeScript-first team, edge deployment requirements, cold-boot sensitivity. But the ops team knew Node.js. They had Kubernetes manifests, monitoring dashboards, runbooks, muscle memory. Retraining that institutional knowledge costs real money, and it’s invisible to the business. Sometimes the best technical choice loses to the known quantity.

Where Node.js Held Firm

The Node.js ecosystem didn’t stand still while Deno climbed. Beyond the TypeScript support, they’ve modernized aggressively. Native ESM support is now mature. Recent versions ship with meaningful performance improvements. The Fetch API, Web Crypto, all the modern browser APIs that Deno was built on are now first-class in Node.js. The gap that existed three years ago doesn’t exist anymore.

Production maturity still favors Node.js by a wide margin. If something goes wrong at 3 AM, you have better odds of finding a Node.js expert who’s seen that specific problem before. Deno Deploy now handles over 300 billion requests per month, which makes it a legitimate Cloudflare Workers competitor. That’s impressive. But Workers has been running at that scale for years, and the institutional knowledge runs deeper.

The tooling ecosystem around Node.js is also hard to quantify but easy to feel. Jest, ESLint, Prettier, the entire observability stack from Prometheus to Datadog to New Relic—all of it assumes Node.js. Using Deno often means finding Deno-native equivalents or adapting tools built for Node. Most of the time it works fine. Sometimes you’re debugging why some random middleware doesn’t quite behave the way you expected.

The Honest Assessment

A year into production Deno, I’m genuinely interested in where it’s heading, but I’m not pretending it’s a Node.js killer. It’s a better design in many ways, and if you’re building something new with specific constraints—edge deployment, extreme latency sensitivity, a team that wants TypeScript from day one—then Deno deserves serious consideration. The Node.js compatibility layer means you can hedge your bets in ways you couldn’t before 2.0.

But Node.js isn’t going anywhere. It’s the incumbent with deeper roots, a larger ecosystem, and more operational maturity. The realistic picture looks like specialization: Node.js dominates general-purpose server applications because the ecosystem is enormous and the tooling is mature. Deno carves out territory where its design philosophy wins. Edge deployments, TypeScript-first projects, scenarios where cold-boot performance matters. If Deno maintains its current trajectory, that territory could grow substantially.

What I find most interesting is that this competition is forcing both runtimes to get better. Node.js had to finally solve TypeScript properly. Deno has to prove it can build ecosystem scale without abandoning its own design principles. That’s good for everyone shipping production code. If you’re curious whether Deno fits your next project, spin up a small service or API and get some real hands-on time with it. The right answer depends entirely on your specific constraints, and reading about it only gets you so far.

Platform Engineering in 2026: Why Your Internal Developer Platform Still Has a 40% Adoption Problem

The Headcount Trap

In 2023, Gartner made a prediction that looked pretty straightforward: by 2026, 80% of large engineering organizations would have a dedicated platform engineering team. If you’re reading this in 2026, you’ve probably noticed that prediction came true. Most enterprises did build those teams. They hired the senior architects, the infrastructure specialists, the developer experience evangelists. The org charts shifted. Budgets got allocated. Slack channels were created with the kind of naming convention that suggested someone was very serious about this.

Platform Engineering in 2026: Why Your Internal Developer Platform Still Has a 40% Adoption Problem

So why am I sitting here, having just spent two hours talking to a platform team lead at a Fortune 500 company who told me they have 47 people working on their internal developer platform and somehow fewer developers using it this quarter than last? The answer isn’t complicated, but it is humbling. Building the team is the easy part. Getting developers to actually use what you built turns out to be a completely different problem.

The real story isn’t the presence of platform teams. It’s their impact. And right now, at most places, that impact exists at about 60% of where it should.

Illustration for Platform Engineering in 2026: Why Your Internal Developer Platform Still Has a 40% Adoption Problem

The Productivity Paradox That Nobody Talks About

Here’s where things get interesting. The DORA State of DevOps Report 2025 found something concrete: teams with mature internal developer platforms deploy 2.5 times more frequently and have significantly fewer failed deployments compared to teams without them. That’s not marketing speak. That’s measurable, empirical advantage. The kind of data that should make every engineering leader sit up straight.

Except here’s the trap nobody advertises: that 2.5x advantage only exists if developers actually use the platform. If your teams bypass it 40% of the time, you’re looking at very different math. You’ve built something powerful and then watched half your organization decide to go around it because the friction of using it exceeded the friction of not using it.

I’ve watched this play out enough times to recognize the pattern. A team builds something genuinely useful, thoughtfully designed, architecturally sound. And then they’re shocked when adoption plateaus at around 55-60% despite months of evangelism, lunch-and-learns, and carefully crafted documentation.

Why Backstage Adoption Looks Good on the Slide Deck

The CNCF Backstage project page will tell you that over 3,000 companies are using Backstage in production as of late 2025. That number is real. Spotify built something genuinely elegant, the open-source community embraced it, and it solved real problems. But there’s a quieter statistic that doesn’t make it into the conference talks: at many of those organizations, active usage among developers hovers below 50%.

I talked to someone at a well-known tech company whose Backstage rollout hit 52% adoption and then just stopped climbing. Not because the software was bad. Not because the team didn’t try hard enough. They hit a wall that’s surprisingly common: the people who benefited most from centralized developer tooling were already finding workarounds, and everyone else looked at their existing workflow, looked at learning Backstage, and made a rational decision.

What keeps coming up in community discussions is that companies deploy Backstage, Platforms.sh, and homegrown solutions at respectable scale, but the gap between “deployed” and “actually used daily by the developers who benefit most” stays stubbornly large. It’s like building a beautiful transit system but watching people drive anyway because parking is still easier.

Cognitive Overhead Beats Architecture Every Time

Last year’s Puppet State of DevOps survey landed on something specific: developers cite two reasons most often for bypassing their internal platform. First, learning it requires too much cognitive lift for the perceived benefit. Second, it doesn’t integrate with how they actually work. Not how they’re supposed to work. How they actually work.

This distinction matters more than it sounds. A developer can understand why a platform exists in theory and still choose to skip it in practice because the mental model doesn’t map to their daily workflow. You’re asking them to change their muscle memory, their deployment ritual, years of habits and workarounds that do work, even if they’re not optimal.

I watched a platform team spend six months building something with the workflow abstraction they thought developers should want. When adoption stalled, they finally asked developers what they actually wanted. Turns out developers wanted something closer to what they were already doing, just with less clicking and fewer environment variables to manage. The team had to rebuild significant pieces because they’d optimized for elegance instead of continuity.

The hard truth: your internal platform will lose to anything simpler, even if it’s objectively worse, as long as it’s faster to use and requires fewer context switches. Cognitive overhead is a feature killer that no amount of documentation can overcome.

The Terraform Moment and What It Reveals

When HashiCorp’s acquisition by IBM closed in 2024, the ripple effects on Terraform licensing and pricing were immediate. Platform teams who’d standardized on Terraform for infrastructure-as-code suddenly found themselves asking uncomfortable questions. Pricing changed. Licensing got stricter. Open-source alternatives became more interesting. OpenTofu, the community fork, crossed 4 million downloads per month by early 2026.

This migration wave reveals something important: when your platform depends on tooling you don’t control, and that tooling changes in ways that feel adverse, adoption becomes a liability instead of an asset. Teams that had finally gotten developers to use standardized infrastructure tooling suddenly had to decide whether to stick with it or migrate. Some did migrate. Some splintered. Some maintained multiple paths.

Adoption isn’t just about usage. It’s about trust, continuity, and the confidence that the tooling you’re asking people to build habits around won’t suddenly shift underneath them. The platform engineering teams doing best right now aren’t pretending they control the entire landscape. They’re building with open-source first, making intentional technology choices that won’t become licensing nightmares, and being honest about dependencies.

The Path Forward Is Smaller Than You Think

After years of watching internal platforms either stick or get quietly abandoned, I’m convinced the adoption problem isn’t about features or architecture or team size. It’s about matching the cognitive and friction cost to the real benefit developers perceive. That balance point is usually smaller than platform teams think it should be.

The teams making real progress in 2026 are ruthlessly prioritizing the workflows that matter most instead of trying to be everything to everyone. They’re meeting developers where they actually work instead of insisting developers come to them. They’re measuring adoption not by who has access but by who actively uses the platform as their first choice, not their backup plan. They’ve also abandoned the idea that quarterly launch events and documentation blogs create adoption. Adoption happens when using the platform is legitimately easier than not using it.

If you’re building a platform or living inside one that’s stuck below 60% adoption, the next move probably isn’t more features. It’s probably a hard conversation about whether developers actually want what you’ve built, or whether they want something smaller and faster that does 60% of what the platform does.

What’s your platform adoption story? Where’s the friction actually coming from at your organization? I’d genuinely like to hear it.

The 1,200-Entry Reckoning: Why Your Patch Management Is About to Get a Lot More Honest

The Milestone Nobody Wanted to Hit

Late 2025 marked a quiet inflection point that should have triggered a chain reaction of uncomfortable conversations in security offices everywhere. The CISA Known Exploited Vulnerabilities Catalog crossed 1,200 entries. That is not a vanity metric. That is a catalog of vulnerabilities actively being weaponized in the wild, many of them with federal remediation requirements that demand action within 15 days for critical severity ratings under BOD 22-01. For most organizations, this milestone landed like a memo from reality: your patch management strategy, whatever you think it is, is not actually keeping pace with the exploit ecosystem.

The 1,200-Entry Reckoning: Why Your Patch Management Is About to Get a Lot More Honest

The number itself deserves context. These are not theoretical vulnerabilities discovered in lab environments and filed away for future consideration. These are exploited vulnerabilities. Known exploited. The catalog functions as a live threat feed backed by federal authority, and its growth trajectory suggests the problem is accelerating, not stabilizing. When I look at organizations still treating patches as a quarterly maintenance ritual, I see the same pattern that precedes most breaches: confidence that the problem is manageable, paired with systems designed for a threat landscape that no longer exists.

The Timeline Collapse

Here is where the urgency shifts from abstract to operational. The median time between CVE publication and active exploitation has contracted dramatically. The Verizon 2025 Data Breach Investigations Report documented this compression: in 2021, the median window was 32 days. By 2024, it had collapsed to 5 days. Think about that number in the context of your current patch cycle. If your organization operates on a monthly patching schedule, you are already behind the curve. A quarterly cycle means you are not managing risk anymore. You are managing liability.

January 2026 alone added 47 vulnerabilities to the actively exploited catalog, including multiple zero-days in Palo Alto Networks PAN-OS and Ivanti Connect Secure. Both vendors had already released patches before exploitation began in earnest. This is the signal I keep watching: the vendors are moving fast. The exploit community is moving faster. Organizations are moving at corporate consensus speed, which is to say, not fast enough. The gap between patch availability and widespread exploitation used to give you breathing room. That room no longer exists.

The Patch Archaeology Problem

One of the most damning data points in recent vulnerability research came from a 2025 Tenable analysis: 60% of breaches in surveyed organizations involved a known vulnerability for which a patch had been available for more than 30 days at the time of exploitation. Let that settle in. Not unpatched systems in general. Breaches involving vulnerabilities that had patches, often well-documented patches, sitting in vendor advisories while the organization was getting compromised.

This is not a technical problem anymore. Your engineering team is not the constraint. The constraint is organizational friction: competing priorities, change control bureaucracy, infrastructure complexity, understaffing, risk aversion, or the simple reality that patching is tedious and unglamorous work that does not produce revenue. The exploit community does not care about your prioritization framework. Attackers are operating on a 5-day timeline. Your change advisory board meets monthly.

The National Vulnerability Database processed over 40,000 new CVEs in 2024, a 38% increase from 2022. That volume alone is straining the triage pipelines most enterprise security teams rely on. Automated systems are drowning in signal-to-noise problems. Your analysts are spending cycles categorizing vulnerabilities that will never affect your infrastructure while the ones that matter get lost in the volume.

Signal Versus Speculation: What the Numbers Actually Tell Us

I want to separate what we know from what we think we know. The 1,200-entry milestone is real. The 5-day exploitation timeline is documented. The 60% breach statistic is research-backed. These are not predictions or speculation. These are observed behaviors in the current threat landscape.

Where it gets speculative is what happens next. The trajectory suggests that within 18 months, we will see the actively exploited catalog approach or exceed 1,500 entries. The exploitation window will likely compress further as automation improves and exploit frameworks mature. Organizations that do not fundamentally restructure their patch management processes will become statistically more likely to suffer breaches from known vulnerabilities. This is not inevitable. It is predictable. The difference matters because predictable problems have knowable solutions.

What Actually Works, and Why Most Organizations Will Not Do It

The patch management systems that work in this environment share common characteristics: they operate on continuous cycles rather than scheduled batches, they use real-time telemetry to prioritize by actual environmental risk rather than theoretical severity scores, they automate the testing and deployment process to collapse the implementation timeline, and they treat vendor patches as time-sensitive operational inputs rather than optional maintenance tasks. CISA Known Exploited Vulnerabilities Catalog entries should trigger automated workflows, not email notifications to overloaded security teams.

Most organizations will not implement these changes because they require investment in infrastructure, discipline around process, and the political will to say no to other work. It is easier to maintain the illusion of control with quarterly patching than to undertake the organizational restructuring that modern patch management actually demands. This is not cynicism. This is pattern recognition from watching hundreds of post-breach reviews that follow the same script.

The question worth asking yourself is not whether your patch management can theoretically keep pace with the 1,200-entry catalog. The question is whether you are willing to restructure it so that it actually does. If that conversation sounds hard right now, wait until you are explaining to your board why a vulnerability that was patched 45 days ago was the entry point for your breach. The 5-day timeline is not something to debate. It is something to design your entire response infrastructure around.

Why Your Cloud Bill Doubled While You Were Sleeping (And How I Fixed Mine in Four Hours)

The Morning My Slack Went Nuclear

Picture this: you’re sipping coffee at 8 AM when your phone explodes with notifications. The finance team discovered your AWS bill jumped from $12,000 to $24,000 last month, and suddenly everyone wants to know why the “cloud thing” costs more than Sarah’s mortgage. I’ve been that engineer fielding those calls, and let me tell you, explaining Reserved Instance economics to a CFO at 8:15 AM builds character you never knew you needed.

Here’s what I learned from optimizing cloud costs at three different companies: the biggest wins aren’t in the sexy AI optimization tools everyone talks about. They’re in understanding the fundamentals that build up over time. After you’ve been burned by a few surprise bills, you develop a sixth sense for the warning signs. More importantly, you learn which optimization strategies actually move the needle versus those that just make pretty charts for stakeholder meetings.

Right-Sizing: The Art of Goldilocks Infrastructure

The first place I always look is compute right-sizing, because developers have a weird relationship with resource allocation. We’ll spend three hours optimizing a database query that saves 50ms, then deploy that same service on an instance that’s 400% oversized “just to be safe.” I once found a microservice handling 12 requests per day running on a c5.4xlarge instance. The monthly cost for that single service could have funded our team’s coffee budget for a year.

The trick isn’t just downsizing everything. It’s understanding your actual usage patterns versus your paranoia patterns. AWS CloudWatch and similar tools give you detailed metrics, but the real insight comes from matching those metrics with your application behavior. That batch job that spikes CPU to 90% for ten minutes twice a day? Perfect candidate for spot instances or scheduled scaling. That API server that sits at 15% CPU but occasionally hits 80% during marketing campaigns? Maybe it needs better horizontal scaling, not a bigger box.

I’ve saved more money with a simple script that analyzes CloudWatch metrics and flags instances running below 20% average CPU for more than a week than with any enterprise cost optimization platform. The script took me two hours to write and has probably saved six figures across the companies where I’ve used it. Sometimes the most elegant solution is also the most obvious one.

Reserved Instances and Savings Plans: Playing the Long Game

Reserved Instances feel like buying a gym membership. Everyone knows they should do it, but the commitment anxiety is real. What if we need different instance types next year? What if we migrate everything to containers? What if the CTO decides we’re moving to Azure because they read a Medium article?

Here’s the reality check: if you’ve been running the same workload for six months, you’ll probably run something similar for the next year. The key is starting conservative and building confidence. I typically recommend covering 60-70% of your baseline compute with Reserved Instances, leaving room for growth and experimentation. For that steady-state production database that’s been humming along unchanged since 2019? Full three-year commitment. For the new experimental ML pipeline that might get rewritten twice this quarter? Stick with on-demand.

Savings Plans add another layer of flexibility but require more sophisticated planning. They work great if your compute usage is growing but your instance mix is changing. I worked with one team transitioning from EC2 to Fargate where Compute Savings Plans gave us 30% savings during the migration without locking us into specific instance types. The math works out even better if you’re already using multiple compute services across your organization.

Storage Optimization: The Hidden Money Drain

Storage costs sneak up on you like subscription services. You start with a few hundred gigabytes of “essential” data and suddenly you’re paying thousands monthly for files no one has accessed since the Obama administration. I once found 12TB of test data that a developer forgot to delete after a proof-of-concept project ended eighteen months earlier. That particular oversight cost more than the developer’s monthly salary.

The low-hanging fruit is lifecycle policies. S3 Intelligent-Tiering sounds like marketing fluff until you see it automatically move 80% of your data to cheaper storage tiers. For most applications, files older than 30 days can move to Infrequent Access, and anything older than 90 days belongs in Glacier. The exception is compliance data that might need quick retrieval for audits, but even then, you can optimize the 95% of files that won’t be touched.

EBS volumes are the other storage trap. Those extra volumes you attach for testing? They keep running even when the instances are terminated. I’ve seen organizations with hundreds of orphaned EBS volumes costing thousands monthly. A weekly cleanup script that identifies unattached volumes older than seven days pays for itself in the first run. Bonus points for automating snapshots before deletion, because someone always remembers they needed that data right after you clean it up.

Monitoring and Automation: Making Optimization Sustainable

Manual cost optimization is like manual testing. It works until it doesn’t, and it definitely doesn’t scale. The goal is building systems that prevent cost surprises rather than reacting to them. I learned this lesson the hard way when a data science team spun up 50 GPU instances for a weekend experiment and forgot about them. The Monday morning bill was educational for everyone involved.

CloudWatch billing alerts are your first line of defense, but they’re reactive. The real power is in proactive monitoring that catches unusual patterns early. I use custom metrics to track cost per request, cost per user, and cost per deployment. When any of these metrics spike unexpectedly, it triggers an investigation before the monthly bill arrives. Tools like AWS Cost Explorer and third-party platforms like CloudHealth give you deeper insights, but start with the basics before investing in enterprise solutions.

The most effective automation I’ve built combines cost monitoring with automatic fixes. Spot instances that terminate get replaced automatically. Development environments shut down after business hours. Unused load balancers get flagged for review after 48 hours of zero traffic. These aren’t sophisticated AI algorithms predicting the future. They’re simple rules that prevent common mistakes from becoming expensive problems.

What patterns have you noticed in your own cloud bills? The most interesting cost optimization stories often come from the weird edge cases that make you question your assumptions about how these systems actually work.

The Great Rust Migration: How Federal Mandates Are Turning C++ Shops Into Battlegrounds

When Uncle Sam Declares War on Segfaults

Three months ago, I watched a twenty-year veteran C++ architect walk out of a planning meeting and never come back. The trigger wasn’t layoffs or impossible deadlines. It was the moment our government contracts team announced we had eighteen months to migrate our core defense systems from C++ to Rust. The White House cybersecurity guidelines dropped in February 2026 like a precision-guided munition aimed directly at legacy codebases across America. The shockwaves are still rippling through engineering organizations that thought they had decades to figure this out.

The mandate is simple: all critical systems handling federal data must demonstrate memory safety by 2028. No exceptions, no grandfather clauses, no “but our codebase works fine” appeals to tradition. I’ve spent the last six months helping orchestrate one of these migrations. Let me tell you the real story behind the headlines about government efficiency and cyber resilience. This isn’t just a technical challenge. It’s reshaping how engineering teams think about risk, talent, and the true cost of technical debt that’s been piling up since the Clinton administration.

The Economics of Fear-Driven Architecture

Microsoft’s January announcement that sixty-seven percent of their security vulnerabilities between 2019 and 2024 came from memory safety issues wasn’t just a confession. It was a wake-up call that hit every boardroom where executives suddenly realized their C++ investments might be liability bombs waiting to go off. When Google followed up by revealing that Chrome’s Rust migration prevented nearly three thousand potential vulnerabilities last year alone, saving twelve million dollars in incident response costs, the business case for memory-safe languages shifted from “nice to have” to “fiduciary responsibility.”

The talent economics are even more brutal than the security math. Our HR department discovered that Rust developers are commanding ninety-seven thousand dollars average salaries compared to eighty-nine thousand for C++ engineers, and the gap is widening faster than our budget can absorb. We’re not just competing with other defense contractors anymore. We’re bidding against tech companies that view Rust expertise as a strategic advantage, not a compliance checkbox. The Rust Foundation Annual Report 2025 documented enterprise adoption growing by one hundred seventy-eight percent. Suddenly every engineering manager is asking the same question: do we retrain our teams or replace them?

Migration Reality Check: Where Theory Meets Production

Six months into our migration, I’ve learned that rewriting twenty years of battle-tested C++ isn’t like translating between human languages. It’s more like performing surgery while the patient is running a marathon. Our signal processing libraries, optimized through countless iterations and validated against real-world edge cases, can’t simply be ported line by line. Rust’s ownership model forces you to confront architectural assumptions that were buried so deep in C++ patterns that senior engineers had forgotten they were assumptions at all.

The borrow checker doesn’t care about your release deadlines or your comfort with manual memory management. It demands that you articulate the lifetime relationships between data structures with mathematical precision. That sounds academic until you’re debugging why a perfectly reasonable refactoring won’t compile and realizing that your “reasonable” approach was actually a race condition waiting to happen. We’ve discovered bugs in our C++ codebase that had been lurking dormant for years, exposed only because Rust refused to let us encode the same implicit contracts that C++ silently permitted.

The productivity curve looks like a roller coaster designed by someone with a grudge against software engineers. Initial velocity plummets as experienced developers struggle with concepts that feel simultaneously foreign and obvious. But somewhere around month four, something clicks. The same engineers who were cursing the compiler’s pickiness start appreciating how it catches entire categories of bugs before they reach production. We’re moving faster now on new features than we ever did in C++, precisely because we’re spending less time hunting memory corruption in production systems.

The Talent Reshuffling Accelerates

Companies like Dropbox, Meta, and Figma aren’t migrating to Rust because it’s trendy. They’re betting their performance-critical infrastructure on a language that lets them ship faster with fewer catastrophic failures. This creates a feedback loop that’s reshaping the entire engineering talent market. Universities are adding Rust to their curricula, bootcamps are pivoting their advanced tracks, and senior engineers are quietly spending weekends learning ownership patterns instead of optimizing their latest C++ template metaprogramming masterpieces.

The brain drain from legacy shops is real and accelerating. Our most creative C++ developers aren’t just learning Rust—they’re gravitating toward companies that embrace it fully rather than treating it as a compliance obligation. The engineers who thrive in Rust tend to be those who were already thinking carefully about resource management and concurrent safety. Which means they were probably your best C++ developers too. Losing them doesn’t just slow down the migration. It removes the institutional knowledge needed to maintain existing systems during the transition period.

Beyond Compliance: What This Really Changes

The federal mandate isn’t just forcing a language migration. It’s changing how we think about software reliability and technical risk management. Memory safety violations are no longer acceptable “cost of doing business” trade-offs that we patch and monitor. They’re becoming existential threats to contract renewals and competitive positioning. This shift in perspective ripples through design decisions, testing strategies, and even hiring criteria in ways that extend far beyond the specific choice of programming language.

The most successful migrations I’ve observed aren’t treating Rust adoption as a translation project but as an opportunity to revisit architectural assumptions that were encoded when memory was expensive and threat models were simpler. Teams that embrace the borrow checker’s constraints often discover that the resulting designs are not just safer but more maintainable and better suited to modern deployment patterns. The federal guidelines may have forced the timeline, but the underlying technical and business drivers were already building momentum toward memory-safe alternatives.

What’s your organization’s strategy? Are you treating this as a compliance checkbox or an architectural opportunity? The next eighteen months will separate the companies that adapt gracefully from those that stumble through forced migrations. The difference often comes down to how engineering leadership frames the challenge for their teams.

The Distributed Systems Debug That Made Me Question Everything I Knew About Observability

When Your Mental Model Becomes Your Enemy

Three months ago, I was staring at a Grafana dashboard that showed everything was fine while our payment service was quietly dropping 12% of transactions. CPU usage looked normal. Memory stable. Network latency within bounds. The alerting system was silent. Yet money was disappearing into the ether, and our CFO was asking increasingly pointed questions about revenue discrepancies.

This is the moment when debugging distributed systems stops being an intellectual exercise and becomes a humbling reminder that complex systems have emergent behaviors that laugh at your carefully constructed mental models. The bug wasn’t in the code. It wasn’t in the infrastructure. It was in the spaces between things, in the assumptions we’d baked into our monitoring strategy three years ago when the system was a tenth of its current complexity.

The Hidden Weapon: Distributed Tracing with Jaeger and Custom Spans

Most teams implement distributed tracing like they’re checking a box. They instrument HTTP requests, database calls, maybe message queue operations if they’re feeling ambitious. But the real debugging power comes from instrumenting the business logic itself. In our payment service fiasco, the breakthrough came when I started adding custom spans around decision points in the code.

Instead of just tracing “payment_processed” at the service boundary, I added spans for “fraud_check_initiated,” “risk_assessment_completed,” and “settlement_queued.” What emerged was a pattern invisible to traditional metrics: payments were being marked as successful after fraud checks but before risk assessment completion. A race condition in our async processing pipeline meant that 12% of payments were falling into a state that existed nowhere in our original design documents.

The killer feature isn’t Jaeger’s UI, though it’s solid. It’s the ability to query traces programmatically. I wrote a simple script that pulled all payment traces from the last week and grouped them by their span completion patterns. The anomaly jumped out immediately: successful payments should have exactly seven spans, but 12% had only six. Traditional monitoring would have missed this entirely because each individual service was behaving correctly.

Chaos Engineering: The Debugger You Run on Purpose

Here’s something that took me embarrassingly long to realize: the best debugging happens before the bugs reach production. Chaos engineering isn’t just Netflix showing off. It’s a debugging methodology disguised as reliability testing. Tools like Litmus and Gremlin let you inject failures in controlled ways, but the real insight comes from building your own lightweight chaos experiments.

I maintain a simple Python script that randomly delays network calls by 50-200ms in our staging environment. Nothing fancy, just a decorator that wraps service calls with artificial latency. Running this for a week revealed three separate timeout cascade failures that would have been nightmarish to debug in production. The payment service bug? It actually surfaced during one of these chaos experiments six weeks before it hit production, but we dismissed it as test environment weirdness.

The underrated part isn’t the failure injection itself. It’s the discipline of treating every chaos experiment like a debugging session. Document what you expect to break. When something unexpected breaks, that’s your system teaching you about reality. Most distributed systems bugs aren’t random. They’re deterministic responses to conditions you haven’t encountered yet.

Event Sourcing as a Time Machine for Debugging

Traditional databases are terrible witnesses. They tell you what happened, but not how it happened or what almost happened. Event sourcing changes debugging from archaeology to time travel. When our recommendation engine started serving stale data to 15% of users, the bug wasn’t in the current state. It was in the sequence of events that led to that state.

Our event store showed that recommendation cache invalidation events were arriving out of order during high-traffic periods. The cache was being invalidated and then immediately repopulated with stale data by a delayed event. Traditional debugging would have focused on the cache behavior itself, but the event log revealed the real culprit: network partition recovery was replaying events without considering their semantic ordering.

The debugging superpower isn’t just replaying events. It’s being able to fork reality. I can take our production event stream, replay it up to the point where the bug manifests, then replay it again with a proposed fix. No staging environment can replicate the exact conditions of production, but your production event log can. This technique has cut our mean time to resolution for complex state bugs from days to hours.

The Social Architecture of Distributed Debugging

The hardest distributed systems bugs aren’t technical. They’re organizational. Services owned by different teams develop incompatible assumptions about contract behavior. The payment service assumed the fraud detection service would always respond within 2 seconds. The fraud team assumed they had up to 10 seconds for complex cases. Both teams were right according to their documentation. Both teams were wrong in practice.

I’ve started maintaining what I call a “debugging runbook” that’s less about technical procedures and more about human coordination. When a distributed system bug spans team boundaries, the first 30 minutes usually involve five different Slack channels, three video calls, and at least one engineer insisting the problem is definitely not in their service. The runbook short-circuits this with clear escalation paths and shared debugging artifacts.

The most valuable debugging tool I’ve built isn’t code. It’s a shared Notion workspace where we document cross-service assumptions and their verification methods. When the payment bug hit, we had the fraud team, the risk assessment team, and the settlement team all debugging independently. The shared workspace let us correlate findings in real time and avoid duplicate effort. It turns out that debugging distributed systems is itself a distributed systems problem.

The Debugging Mindset That Actually Works

Distributed systems debugging requires a fundamentally different mental approach than debugging monoliths. You can’t step through the code because there is no single execution path. You can’t reproduce the bug locally because the bug is an emergent property of scale and timing. The debugging mindset that works is more like detective work: you’re reconstructing what happened from partial evidence across multiple crime scenes.

The breakthrough insight is that bugs in distributed systems are usually not bugs in any individual component. They’re bugs in the assumptions that connect components. The payment service bug wasn’t a race condition in the traditional sense. It was a race condition between our mental model of how the system should work and how it actually worked under load. The fraud service, risk assessment service, and settlement service were all working perfectly. The bug was in the gaps between them.

Next time you’re knee-deep in distributed systems debugging, remember that the system is trying to tell you something about reality that contradicts your assumptions. Listen to what it’s actually doing, not what you think it should be doing. The most elegant solutions often come from embracing the system’s actual behavior rather than fighting it.