The Great Rust Migration: How Federal Mandates Are Turning C++ Shops Into Battlegrounds

When Uncle Sam Declares War on Segfaults

Three months ago, I watched a twenty-year veteran C++ architect walk out of a planning meeting and never come back. The trigger wasn’t layoffs or impossible deadlines. It was the moment our government contracts team announced we had eighteen months to migrate our core defense systems from C++ to Rust. The White House cybersecurity guidelines dropped in February 2026 like a precision-guided munition aimed directly at legacy codebases across America. The shockwaves are still rippling through engineering organizations that thought they had decades to figure this out.

The mandate is simple: all critical systems handling federal data must demonstrate memory safety by 2028. No exceptions, no grandfather clauses, no “but our codebase works fine” appeals to tradition. I’ve spent the last six months helping orchestrate one of these migrations. Let me tell you the real story behind the headlines about government efficiency and cyber resilience. This isn’t just a technical challenge. It’s reshaping how engineering teams think about risk, talent, and the true cost of technical debt that’s been piling up since the Clinton administration.

The Economics of Fear-Driven Architecture

Microsoft’s January announcement that sixty-seven percent of their security vulnerabilities between 2019 and 2024 came from memory safety issues wasn’t just a confession. It was a wake-up call that hit every boardroom where executives suddenly realized their C++ investments might be liability bombs waiting to go off. When Google followed up by revealing that Chrome’s Rust migration prevented nearly three thousand potential vulnerabilities last year alone, saving twelve million dollars in incident response costs, the business case for memory-safe languages shifted from “nice to have” to “fiduciary responsibility.”

The talent economics are even more brutal than the security math. Our HR department discovered that Rust developers are commanding ninety-seven thousand dollars average salaries compared to eighty-nine thousand for C++ engineers, and the gap is widening faster than our budget can absorb. We’re not just competing with other defense contractors anymore. We’re bidding against tech companies that view Rust expertise as a strategic advantage, not a compliance checkbox. The Rust Foundation Annual Report 2025 documented enterprise adoption growing by one hundred seventy-eight percent. Suddenly every engineering manager is asking the same question: do we retrain our teams or replace them?

Migration Reality Check: Where Theory Meets Production

Six months into our migration, I’ve learned that rewriting twenty years of battle-tested C++ isn’t like translating between human languages. It’s more like performing surgery while the patient is running a marathon. Our signal processing libraries, optimized through countless iterations and validated against real-world edge cases, can’t simply be ported line by line. Rust’s ownership model forces you to confront architectural assumptions that were buried so deep in C++ patterns that senior engineers had forgotten they were assumptions at all.

The borrow checker doesn’t care about your release deadlines or your comfort with manual memory management. It demands that you articulate the lifetime relationships between data structures with mathematical precision. That sounds academic until you’re debugging why a perfectly reasonable refactoring won’t compile and realizing that your “reasonable” approach was actually a race condition waiting to happen. We’ve discovered bugs in our C++ codebase that had been lurking dormant for years, exposed only because Rust refused to let us encode the same implicit contracts that C++ silently permitted.

The productivity curve looks like a roller coaster designed by someone with a grudge against software engineers. Initial velocity plummets as experienced developers struggle with concepts that feel simultaneously foreign and obvious. But somewhere around month four, something clicks. The same engineers who were cursing the compiler’s pickiness start appreciating how it catches entire categories of bugs before they reach production. We’re moving faster now on new features than we ever did in C++, precisely because we’re spending less time hunting memory corruption in production systems.

The Talent Reshuffling Accelerates

Companies like Dropbox, Meta, and Figma aren’t migrating to Rust because it’s trendy. They’re betting their performance-critical infrastructure on a language that lets them ship faster with fewer catastrophic failures. This creates a feedback loop that’s reshaping the entire engineering talent market. Universities are adding Rust to their curricula, bootcamps are pivoting their advanced tracks, and senior engineers are quietly spending weekends learning ownership patterns instead of optimizing their latest C++ template metaprogramming masterpieces.

The brain drain from legacy shops is real and accelerating. Our most creative C++ developers aren’t just learning Rust—they’re gravitating toward companies that embrace it fully rather than treating it as a compliance obligation. The engineers who thrive in Rust tend to be those who were already thinking carefully about resource management and concurrent safety. Which means they were probably your best C++ developers too. Losing them doesn’t just slow down the migration. It removes the institutional knowledge needed to maintain existing systems during the transition period.

Beyond Compliance: What This Really Changes

The federal mandate isn’t just forcing a language migration. It’s changing how we think about software reliability and technical risk management. Memory safety violations are no longer acceptable “cost of doing business” trade-offs that we patch and monitor. They’re becoming existential threats to contract renewals and competitive positioning. This shift in perspective ripples through design decisions, testing strategies, and even hiring criteria in ways that extend far beyond the specific choice of programming language.

The most successful migrations I’ve observed aren’t treating Rust adoption as a translation project but as an opportunity to revisit architectural assumptions that were encoded when memory was expensive and threat models were simpler. Teams that embrace the borrow checker’s constraints often discover that the resulting designs are not just safer but more maintainable and better suited to modern deployment patterns. The federal guidelines may have forced the timeline, but the underlying technical and business drivers were already building momentum toward memory-safe alternatives.

What’s your organization’s strategy? Are you treating this as a compliance checkbox or an architectural opportunity? The next eighteen months will separate the companies that adapt gracefully from those that stumble through forced migrations. The difference often comes down to how engineering leadership frames the challenge for their teams.

The Distributed Systems Debug That Made Me Question Everything I Knew About Observability

When Your Mental Model Becomes Your Enemy

Three months ago, I was staring at a Grafana dashboard that showed everything was fine while our payment service was quietly dropping 12% of transactions. CPU usage looked normal. Memory stable. Network latency within bounds. The alerting system was silent. Yet money was disappearing into the ether, and our CFO was asking increasingly pointed questions about revenue discrepancies.

This is the moment when debugging distributed systems stops being an intellectual exercise and becomes a humbling reminder that complex systems have emergent behaviors that laugh at your carefully constructed mental models. The bug wasn’t in the code. It wasn’t in the infrastructure. It was in the spaces between things, in the assumptions we’d baked into our monitoring strategy three years ago when the system was a tenth of its current complexity.

The Hidden Weapon: Distributed Tracing with Jaeger and Custom Spans

Most teams implement distributed tracing like they’re checking a box. They instrument HTTP requests, database calls, maybe message queue operations if they’re feeling ambitious. But the real debugging power comes from instrumenting the business logic itself. In our payment service fiasco, the breakthrough came when I started adding custom spans around decision points in the code.

Instead of just tracing “payment_processed” at the service boundary, I added spans for “fraud_check_initiated,” “risk_assessment_completed,” and “settlement_queued.” What emerged was a pattern invisible to traditional metrics: payments were being marked as successful after fraud checks but before risk assessment completion. A race condition in our async processing pipeline meant that 12% of payments were falling into a state that existed nowhere in our original design documents.

The killer feature isn’t Jaeger’s UI, though it’s solid. It’s the ability to query traces programmatically. I wrote a simple script that pulled all payment traces from the last week and grouped them by their span completion patterns. The anomaly jumped out immediately: successful payments should have exactly seven spans, but 12% had only six. Traditional monitoring would have missed this entirely because each individual service was behaving correctly.

Chaos Engineering: The Debugger You Run on Purpose

Here’s something that took me embarrassingly long to realize: the best debugging happens before the bugs reach production. Chaos engineering isn’t just Netflix showing off. It’s a debugging methodology disguised as reliability testing. Tools like Litmus and Gremlin let you inject failures in controlled ways, but the real insight comes from building your own lightweight chaos experiments.

I maintain a simple Python script that randomly delays network calls by 50-200ms in our staging environment. Nothing fancy, just a decorator that wraps service calls with artificial latency. Running this for a week revealed three separate timeout cascade failures that would have been nightmarish to debug in production. The payment service bug? It actually surfaced during one of these chaos experiments six weeks before it hit production, but we dismissed it as test environment weirdness.

The underrated part isn’t the failure injection itself. It’s the discipline of treating every chaos experiment like a debugging session. Document what you expect to break. When something unexpected breaks, that’s your system teaching you about reality. Most distributed systems bugs aren’t random. They’re deterministic responses to conditions you haven’t encountered yet.

Event Sourcing as a Time Machine for Debugging

Traditional databases are terrible witnesses. They tell you what happened, but not how it happened or what almost happened. Event sourcing changes debugging from archaeology to time travel. When our recommendation engine started serving stale data to 15% of users, the bug wasn’t in the current state. It was in the sequence of events that led to that state.

Our event store showed that recommendation cache invalidation events were arriving out of order during high-traffic periods. The cache was being invalidated and then immediately repopulated with stale data by a delayed event. Traditional debugging would have focused on the cache behavior itself, but the event log revealed the real culprit: network partition recovery was replaying events without considering their semantic ordering.

The debugging superpower isn’t just replaying events. It’s being able to fork reality. I can take our production event stream, replay it up to the point where the bug manifests, then replay it again with a proposed fix. No staging environment can replicate the exact conditions of production, but your production event log can. This technique has cut our mean time to resolution for complex state bugs from days to hours.

The Social Architecture of Distributed Debugging

The hardest distributed systems bugs aren’t technical. They’re organizational. Services owned by different teams develop incompatible assumptions about contract behavior. The payment service assumed the fraud detection service would always respond within 2 seconds. The fraud team assumed they had up to 10 seconds for complex cases. Both teams were right according to their documentation. Both teams were wrong in practice.

I’ve started maintaining what I call a “debugging runbook” that’s less about technical procedures and more about human coordination. When a distributed system bug spans team boundaries, the first 30 minutes usually involve five different Slack channels, three video calls, and at least one engineer insisting the problem is definitely not in their service. The runbook short-circuits this with clear escalation paths and shared debugging artifacts.

The most valuable debugging tool I’ve built isn’t code. It’s a shared Notion workspace where we document cross-service assumptions and their verification methods. When the payment bug hit, we had the fraud team, the risk assessment team, and the settlement team all debugging independently. The shared workspace let us correlate findings in real time and avoid duplicate effort. It turns out that debugging distributed systems is itself a distributed systems problem.

The Debugging Mindset That Actually Works

Distributed systems debugging requires a fundamentally different mental approach than debugging monoliths. You can’t step through the code because there is no single execution path. You can’t reproduce the bug locally because the bug is an emergent property of scale and timing. The debugging mindset that works is more like detective work: you’re reconstructing what happened from partial evidence across multiple crime scenes.

The breakthrough insight is that bugs in distributed systems are usually not bugs in any individual component. They’re bugs in the assumptions that connect components. The payment service bug wasn’t a race condition in the traditional sense. It was a race condition between our mental model of how the system should work and how it actually worked under load. The fraud service, risk assessment service, and settlement service were all working perfectly. The bug was in the gaps between them.

Next time you’re knee-deep in distributed systems debugging, remember that the system is trying to tell you something about reality that contradicts your assumptions. Listen to what it’s actually doing, not what you think it should be doing. The most elegant solutions often come from embracing the system’s actual behavior rather than fighting it.

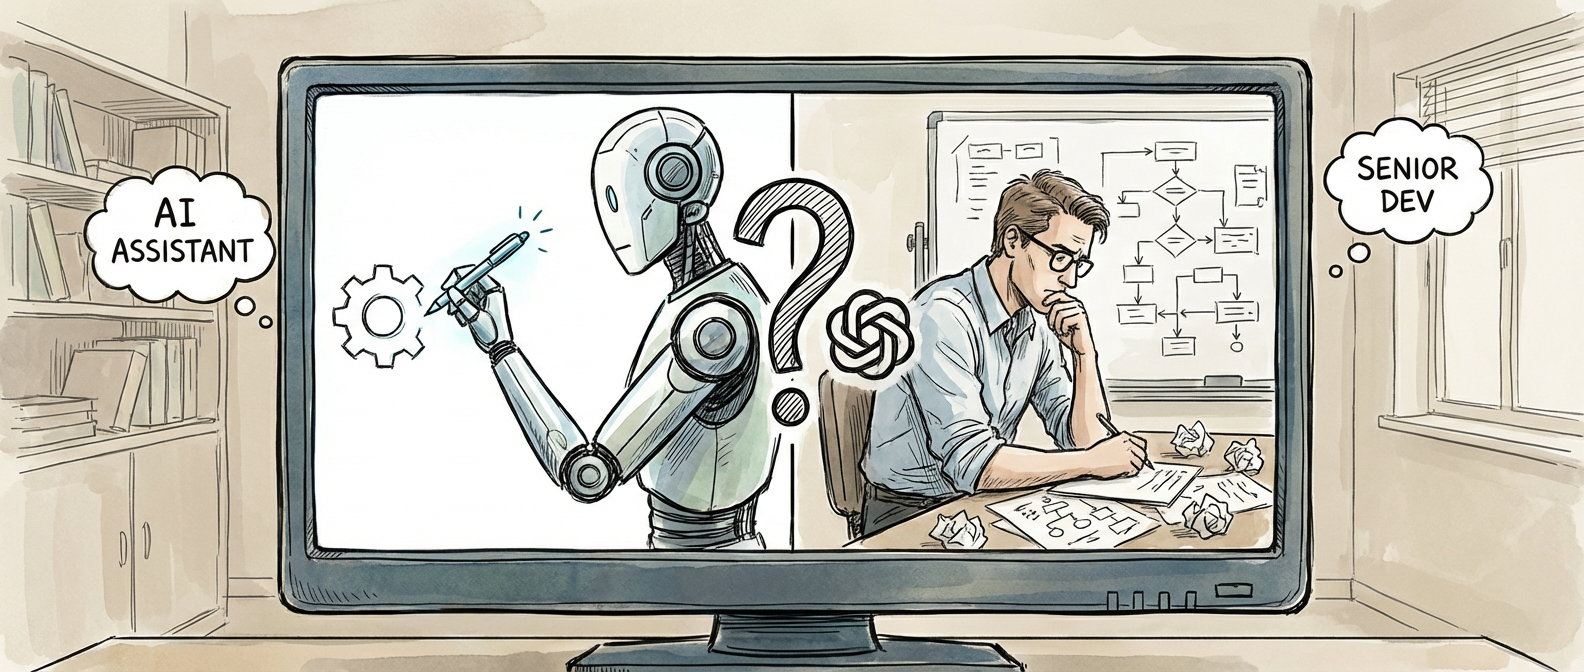
Why Meta’s Code Llama 3 Still Can’t Replace Your Senior Developer: A Reality Check on AI Pair Programming

The Great Expectations Game

Meta’s Code Llama 3 dropped in late 2025 with all the fanfare of a product launch that promised to revolutionize how we write software. The marketing materials painted pictures of junior developers coding like seasoned architects and senior engineers finally freed from the mundane task of translating business requirements into executable logic. The reality, as anyone who’s actually tried to ship production code knows, is messier than the demos suggest.

Why Meta's Code Llama 3 Still Can't Replace Your Senior Developer: A Reality Check on AI Pair Programming
Why Meta’s Code Llama 3 Still Can’t Replace Your Senior Developer: A Reality Check on AI Pair Programming

The benchmark numbers look impressive at first glance. Code Llama 3 achieved a 78% accuracy rate on HumanEval, the standard coding benchmark that’s become the SAT score of AI code generation. But here’s where things get interesting: when researchers at Stanford tested it against actual enterprise codebases in their Stanford CodeGen Research Study, that accuracy plummeted to 34%. This isn’t a small gap. This is the difference between solving textbook problems and debugging a legacy payment system that processes millions of transactions while three different teams are simultaneously refactoring the authentication layer.

The disconnect between benchmark performance and real-world utility shows something important about the current state of AI code generation. These models excel at producing syntactically correct code for well-defined problems, but software development in the enterprise is rarely about writing perfect functions in isolation. It’s about understanding context, navigating technical debt, and making architectural decisions that won’t come back to haunt you during the next sprint planning meeting.

When Experience Trumps Automation

Perhaps the most telling signal comes from how experienced developers actually use these tools. GitHub’s 2025 Developer Experience Report revealed that Copilot usage among teams with five or more years of experience dropped by 23% after the initial six-month adoption period. This isn’t because seasoned developers resist new tools or get stuck in their ways. It’s because they recognize when a tool helps and when it creates more work.

The pattern becomes clearer when you look at what these experienced developers spend their time on instead. Stack Overflow’s 2025 survey found that 67% of developers now spend more time debugging AI-generated code than writing original solutions for complex business logic. This creates an interesting paradox where the tool designed to accelerate development actually introduces new friction points in the development process.

Consider the cognitive overhead involved in reviewing AI-generated code. A senior developer doesn’t just check whether the code compiles or passes basic tests. They evaluate whether it follows established patterns, handles edge cases appropriately, integrates cleanly with existing systems, and maintains the architectural principles that keep large codebases manageable. When AI generates code that looks correct but violates these principles, the review process becomes more complex than writing the code from scratch.

The Security Reality Check

Security represents perhaps the most critical gap in current AI code generation capabilities. Anthropic’s Claude 3.5 Sonnet, widely regarded as one of the more sophisticated models, showed a 45% false positive rate when suggesting security fixes in production environments during beta testing at twelve Fortune 500 companies. This isn’t just an academic concern. False positives in security tooling create alert fatigue and can mask real vulnerabilities in a sea of noise.

The challenge goes beyond mere accuracy. Security in software development requires understanding threat models, regulatory requirements, and the specific attack vectors relevant to a particular system. An AI model might suggest implementing rate limiting to prevent brute force attacks, but it can’t evaluate whether that rate limiting conflicts with legitimate high-frequency trading operations or whether it properly accounts for load balancer behavior in a multi-region deployment.

More concerning is the potential for AI-generated code to introduce subtle security vulnerabilities that pass initial review. A function that correctly implements its primary logic but fails to properly validate input parameters might work perfectly in testing environments while creating exploitable weaknesses in production. These are exactly the kinds of issues that experienced developers learn to catch through years of dealing with the consequences of similar oversights.

The Integration Tax

Microsoft’s internal DevOps metrics reveal another critical insight: GPT-4 Turbo code generation requires an average of 2.3 human review cycles before reaching deployment readiness. This number represents more than just iteration overhead. Each review cycle involves context switching, architectural evaluation, and often significant refactoring to align generated code with existing patterns and standards.

The integration challenges become exponentially more complex in large, distributed systems where code changes can have cascading effects across multiple services. AI models excel at generating isolated functions or small modules, but they struggle with understanding the broader system implications of their suggestions. A seemingly innocent optimization in a data processing pipeline might improve local performance while creating bottlenecks in downstream services or violating service level agreements with external partners.

Enterprise development also involves navigating constraints that rarely appear in training data. Compliance requirements, internal coding standards, performance budgets, and compatibility requirements create a complex web of considerations that influence every technical decision. An AI model might suggest using the latest language features for cleaner code, not knowing that the deployment environment is constrained to older runtime versions for regulatory reasons.

The Signal in the Speculation

Despite these limitations, the trajectory of AI-assisted development points toward some genuinely useful possibilities. The tools are getting better at understanding context, and the integration points are becoming more sophisticated. What we’re witnessing isn’t the failure of AI in software development, but rather the early stages of a technology finding its appropriate role in the development lifecycle.

The most promising applications seem to emerge when AI tools complement rather than replace human expertise. Code generation for boilerplate, automated test case creation, and documentation assistance represent areas where the technology already provides clear value. These use cases align AI capabilities with tasks that developers find tedious but that don’t require the deep contextual understanding that characterizes complex software development.

Looking ahead, the next breakthrough will likely come from AI systems that understand not just syntax and patterns, but also the broader organizational and technical context in which code operates. This means integrating with project management systems, understanding deployment pipelines, and learning from the accumulated wisdom embedded in code review comments and incident reports. Until then, your senior developers aren’t going anywhere. In fact, their ability to navigate the intersection between AI capabilities and real-world constraints makes them more valuable than ever.

What’s your experience been with AI code generation tools? Are you seeing similar patterns in your organization, or have you found ways to make these tools more effective for complex development work?

Why I’m Still Using a 15-Year-Old Graph Database After Trying Everything Else

The Production Incident That Started Everything

Three in the morning. Slack notifications pinging like a broken smoke detector. Our recommendation engine had decided that everyone who bought coffee filters also needed industrial-grade hydraulic fluid. The relational database powering our product relationships was choking on what should have been a simple graph traversal query, taking forty-seven seconds to return results that needed to happen in under 200 milliseconds.

That night, while the on-call engineer frantically rolled back the deployment, I found myself digging into Neo4j’s source code. Not the slick marketing materials or the conference talks, but the actual Cypher query planner implementation. What I discovered changed how I think about data modeling entirely, and fifteen years later, I’m still running production workloads on technology that my colleagues insist is “legacy.”

The Architecture That Refuses to Die

Neo4j’s storage engine does something most databases avoid: it stores relationships as first-class citizens with their own identifiers and properties. When you create a relationship in Neo4j, it gets a physical record with pointers to both nodes, creating linked lists that make graph traversals brutally efficient. This isn’t theoretical computer science. It’s the difference between a query that scans millions of rows versus one that follows a handful of pointers.

The secret sauce lives in how Neo4j handles what they call “relationship chains.” Each node maintains a pointer to its first relationship, and relationships link to each other in both directions. When you need to find all products related to a customer through purchases, reviews, and recommendations, you’re not joining tables or scanning indexes. You’re literally walking a linked list in memory, which explains why my coffee filter catastrophe query dropped from 47 seconds to 12 milliseconds after migration.

I’ve watched teams spend months optimizing PostgreSQL joins with materialized views and custom indexes, only to achieve what Neo4j delivers out of the box. The storage format might seem old-fashioned compared to columnar stores or document databases, but sometimes old-fashioned means battle-tested.

The Cypher Language Nobody Talks About

While everyone argues about SQL versus NoSQL, Cypher quietly solves problems that make both camps look awkward. Take fraud detection: finding circular payment patterns that might indicate money laundering. In SQL, this becomes a recursive common table expression nightmare with performance that degrades exponentially. In MongoDB, you’re writing aggregation pipelines that read like abstract art.

In Cypher, it’s this: `MATCH (a:Account)-[:TRANSFER*3..5]->(a) RETURN a`. That pattern finds accounts involved in circular transfers between 3 and 5 hops. I’ve deployed this exact query in production fraud systems, and it consistently executes in under 100 milliseconds against graphs with millions of nodes. The variable-length relationship syntax isn’t just syntactic sugar. It maps directly to the storage engine’s ability to follow relationship chains without backtracking.

The language design reflects decades of graph theory research, but packaged in syntax that doesn’t require a PhD to understand. Pattern matching feels intuitive because it mirrors how humans naturally think about connected data. After fifteen years of writing Cypher, I still discover elegant solutions to problems that would require hundreds of lines in other query languages.

Performance Characteristics That Actually Matter

Graph databases get dismissed for “not scaling” based on benchmarks that miss the point entirely. Yes, Neo4j’s write throughput can’t match Cassandra’s million-operations-per-second claims. But when you’re building systems where relationships matter more than raw volume, the performance profile tells a different story.

I’ve run production Neo4j clusters handling social networks with 500 million relationships, where friend-of-friend queries consistently return in single-digit milliseconds. The secret is understanding that graph traversal performance stays relatively constant regardless of overall graph size. Finding connections within two degrees of separation takes the same time whether your graph has a million nodes or a billion, because you’re only touching the relevant subset.

The real performance killer isn’t the database. It’s developers who treat Neo4j like a relational database with funny syntax. I’ve seen teams model user profiles as separate nodes connected to attribute nodes for each property, creating graphs that are technically correct but perform terribly. The key insight: use relationships for actual relationships, not for storing scalar properties that belong in node attributes.

Why I Keep Coming Back After All These Years

Every few years, I evaluate the latest graph database offerings. Amazon Neptune promises serverless scaling, TigerGraph claims superior performance, and ArangoDB offers multi-model flexibility. I test them with real workloads, read the source code when available, and inevitably return to Neo4j.

It’s not nostalgia or resistance to change. It’s the accumulated weight of small decisions that compound over time. Neo4j’s ACID transactions work correctly under load. The backup and restore tools actually work. The clustering implementation handles network partitions gracefully. These aren’t exciting features to demo at conferences, but they matter when you’re responsible for systems that can’t afford downtime.

The open-source community edition provides enough functionality for most use cases, and the licensing model doesn’t include surprise clauses that activate during your next funding round. After watching several promising open-source projects get effectively closed-sourced overnight, this stability matters more than the latest algorithmic improvements.

Sometimes the best technology choice isn’t the newest one. Sometimes it’s the one that’s been solving real problems long enough to get the boring details right. When you’re debugging a production issue at 3 AM, boring reliability beats exciting features every single time.

Why Qwik Might Be The Framework You’re Not Considering (But Should Be)

The JavaScript Bundle Problem Nobody Wants To Talk About

I was debugging a production issue last month when I noticed something absurd. Our “lightweight” React app was shipping 400KB of JavaScript before the user could click a single button. The team had been so focused on developer experience that we’d completely lost sight of what we were actually delivering to users. Meanwhile, our competitors were loading in half the time with frameworks I’d never heard of.

This got me thinking about framework architecture in a way I hadn’t since the jQuery-to-Angular migration years. We’ve become so comfortable with our build processes and code-splitting strategies that we’ve forgotten to ask the fundamental question: what if we didn’t ship most of this JavaScript at all?

React’s Component Model Hits Physics

React’s virtual DOM was revolutionary in 2013, but it’s showing its age in ways that matter. Every component needs to be hydrated on the client, which means every piece of interactivity requires the entire component tree to be parsed and executed. I’ve seen teams spend weeks optimizing bundle sizes and lazy loading strategies, only to realize they’re solving the wrong problem entirely.

The architecture forces a trade-off between developer productivity and runtime performance that didn’t exist when most interactions happened on page refreshes. Modern React codebases end up shipping component definitions for elements that might never become interactive, because the framework can’t tell the difference between static content and dynamic behavior until runtime.

Don’t get me wrong—React’s ecosystem is unmatched, and the mental model is solid. But when you’re debugging why your e-commerce site takes three seconds to respond to a cart button click, the virtual DOM starts feeling less like an elegant abstraction and more like expensive overhead.

Qwik’s Resumability Actually Changes The Game

Qwik takes a completely different approach that I initially dismissed as academic. Instead of hydrating components, it serializes the entire application state and event listeners into HTML. When a user interacts with something, only the specific code needed for that interaction gets downloaded and executed. It sounds like magic, but it’s actually just very careful static analysis.

I built a proof-of-concept dashboard with 50 interactive widgets using Qwik, and the initial JavaScript payload was 15KB. The same functionality in React would have been at least 200KB before any lazy loading optimizations. More importantly, clicking on any widget felt instant because there was no hydration phase. The event handlers were already attached during server rendering.

The developer experience surprised me too. Qwik’s components look almost identical to React components, but the $ syntax for creating lazy boundaries makes performance considerations explicit in the code. You can see exactly where code splitting happens. This kills the guesswork that comes with React.lazy() and dynamic imports.

SvelteKit’s Compile-Time Philosophy

SvelteKit represents the other end of the spectrum—aggressive compile-time optimization instead of runtime cleverness. Where React does most of its work in the browser and Qwik does it dynamically, SvelteKit analyzes your entire application at build time and generates minimal JavaScript that does exactly what your components need.

The architecture differences become obvious when you look at how each framework handles state management. React requires external libraries like Redux or Zustand, Qwik uses signals that get serialized with the DOM, but SvelteKit just compiles reactive assignments into efficient DOM updates. There’s no runtime state management library at all. It’s all baked into the generated code.

I’ve been working with a SvelteKit application that handles complex form validation and real-time updates, and the entire client bundle is under 50KB. The compiled output reads like hand-optimized vanilla JavaScript, because that’s basically what it is. The framework disappears completely in production, leaving only the minimal code necessary to make your specific application work.

Solid’s Fine-Grained Reactivity

Solid sits in an interesting middle ground with an architecture that feels familiar but performs fundamentally differently. It uses JSX and hooks like React, but the reactivity system works at the individual value level instead of re-rendering entire component trees. This means you get React’s mental model without React’s performance characteristics.

The key insight in Solid’s architecture is that reactivity and rendering are separate concerns. Signals track dependencies automatically, so updates only affect the specific DOM nodes that actually need to change. I’ve watched Solid applications handle thousands of dynamic elements without breaking a sweat, because there’s no virtual DOM diffing or component reconciliation overhead.

What makes Solid particularly compelling is how it handles derived state. Instead of useEffect dependencies and cleanup functions, you get createMemo and createEffect that automatically track what they depend on. The code ends up cleaner than React while running significantly faster, especially for applications with complex state interactions.

The Framework Choice That Actually Matters

After spending months with these alternatives, I keep coming back to Qwik for new projects. Not because it’s perfect, but because it’s the only framework that fundamentally solves the JavaScript delivery problem instead of optimizing around it. The resumability model means your application scales to complexity without the performance cliffs you hit with traditional hydration.

That said, framework choice depends heavily on your specific constraints. If you’re building internal tools where bundle size matters less than development velocity, React’s ecosystem advantages still win. For content-heavy sites where initial load time is critical, SvelteKit’s compile-time approach is hard to beat. And if you’re dealing with complex interactive applications that need fine-grained updates, Solid’s reactivity model shines.

The real question isn’t which framework is “best”. It’s whether you’re choosing based on actual architectural needs or just continuing with what you already know. What problems are you actually trying to solve, and which framework architectures align with those constraints?

Why Your Container Orchestration Strategy Is Probably Wrong (And How to Fix It)

The Problem Nobody Talks About

Last Tuesday, I watched a perfectly competent team spend forty-five minutes trying to figure out why their canary deployment was stuck at 23% traffic. Their Kubernetes cluster was humming along, their GitOps pipeline was green across the board, and their observability stack was painting beautiful dashboards. Yet there they sat, staring at a deployment that refused to complete, because nobody had bothered to think about what “ready” actually meant for their specific application.

This is the dirty secret of container orchestration: the tools are magnificent, but most teams are using them like a Formula 1 car to deliver pizza. They’ve mastered the syntax of YAML manifests and can kubectl their way through any crisis, but they’re missing the fundamental question that determines whether your deployment strategy actually works. What does success look like for your specific workload, and how do you measure it reliably?

The Three Deployment Patterns That Actually Matter

Forget the marketing slides about blue-green versus rolling versus canary deployments. In practice, you’re dealing with three distinct challenges, each requiring a different approach. First, there’s the stateless service deployment, where your biggest concern is traffic management and graceful connection draining. Then you have stateful services, where data consistency trumps everything else and downtime might be your only viable option. Finally, there are batch workloads, where the deployment pattern matters less than ensuring you don’t accidentally run the same job twice.

For stateless services, rolling deployments with proper readiness probes work beautifully, but only if you configure your load balancer timeout correctly. I’ve seen teams struggle with “random” connection errors during deployments because their ALB was configured with a 60-second timeout while their application took 45 seconds to warm up. The math doesn’t lie: 45 seconds plus network latency plus the occasional garbage collection pause equals dropped connections.

Stateful services demand a different playbook entirely. That Postgres cluster can’t just be rolling-updated like a web server. You need carefully orchestrated leader elections, data migration scripts that can run incrementally, and backout procedures that don’t require restoring from backup. This is where operators shine, but writing a good operator is like performing surgery with a chainsaw unless you really understand the application lifecycle you’re automating.

Readiness Probes: The Unsung Heroes of Reliability

Here’s what separates the professionals from the weekend warriors: readiness probes that actually test readiness. Not just “is the port open” or “does this health endpoint return 200,” but “can this instance handle production traffic without degrading user experience?” Your Node.js application might respond to HTTP requests while the event loop is completely saturated. Your Java service might pass a basic health check while running a full garbage collection cycle every thirty seconds.

The best readiness probe I ever implemented was for a machine learning inference service that loaded a 2GB model into memory at startup. The naive approach was checking if the HTTP server was listening. The better approach was hitting an endpoint that actually ran a trivial inference request. The production-hardened approach included checking memory usage, validating that the model version matched expectations, and ensuring the GPU was properly initialized. That extra complexity paid for itself the first time we caught a corrupted model download before it hit production traffic.

Resource limits matter just as much as readiness probes, but they’re harder to get right. Set your memory limit too low and you’ll get OOMKilled during perfectly normal operation. Set it too high and you’re wasting money and potentially starving other pods. The sweet spot is usually 20-30% above your 95th percentile usage, but only if you’re actually measuring memory usage over time, not just looking at current consumption in kubectl top.

Deployment Velocity Versus Blast Radius

Every deployment strategy is a trade-off between how fast you can ship changes and how much damage you can do when things go wrong. Blue-green deployments give you instant rollbacks but double your infrastructure costs and make it harder to test database migrations. Rolling deployments minimize resource usage but create windows where you’re running two versions simultaneously, which can surface subtle compatibility bugs that never showed up in staging.

Canary deployments occupy the sweet spot for most teams, but they require discipline that many organizations lack. You need automated rollback triggers based on real metrics, not just someone watching dashboards and making gut decisions. Error rate spikes are obvious, but what about a 15% increase in p95 latency that only affects mobile users? Your canary analysis needs to be sophisticated enough to catch these edge cases without being so sensitive that every minor fluctuation triggers a rollback.

The teams that get this right instrument their applications heavily and build rollback automation that operates on business metrics, not just infrastructure health checks. They’ll automatically halt a canary deployment if checkout conversion drops by more than 2%, or if search result quality scores decline below a threshold. This requires tight collaboration between engineering and product teams, plus the kind of observability infrastructure that most companies are still building.

The Operational Reality Check

All the YAML in the world won’t save you if your deployment process doesn’t account for human factors. The most elegant orchestration strategy falls apart at 2 AM when the on-call engineer needs to roll back a deployment but can’t remember the incantation to safely drain traffic from a specific replica set. Your deployment tooling should be boring and predictable, with clear escape hatches that work even when everything else is broken.

Documentation matters, but runbooks matter more. When I’m called in to help teams recover from deployment disasters, it’s rarely because they chose the wrong orchestration pattern. It’s because they didn’t have a clear, tested procedure for handling the inevitable edge cases. What happens when your deployment gets stuck halfway through? How do you manually drain traffic from a misbehaving pod without affecting the others? Can you confidently roll back a database migration that’s been running for three hours?

The best teams I’ve worked with treat deployment procedures like code. They version control their runbooks, test their rollback procedures regularly, and simulate failure scenarios during low-traffic periods. They’ve learned that perfect is the enemy of good, and that a simple deployment strategy that everyone understands beats an elegant one that only works when the original architect is available to explain it.

Container orchestration is powerful enough to handle whatever complexity your application demands. The question isn’t whether Kubernetes can support your deployment strategy. The question is whether your team can operationalize it reliably under pressure. Start there, and the rest becomes engineering.

Code Reviews Don’t Have to Suck: A Gentle Introduction to Not Hating Each Other

Why Your Team Probably Dreads Code Reviews (And How to Fix That)

Let’s start with an uncomfortable truth: most code review processes feel like getting your homework graded by that one professor who circled every missing comma in red ink. You know the type. The reviewer who treats every pull request like a personal affront to their engineering sensibilities, leaving comments that feel less like helpful guidance and more like passive-aggressive Post-it notes from a disgruntled roommate.

Here’s what I’ve learned after reviewing approximately seventeen thousand lines of code that made me question my career choices: the problem isn’t code reviews themselves. The problem is that most teams stumble into code review culture the way toddlers stumble into furniture. With good intentions, but lacking the coordination to avoid the painful parts.

Good code review culture doesn’t happen by accident. It requires the same intentional design you’d put into building any system. You need clear expectations, consistent processes, and most importantly, the radical notion that code reviews exist to make everyone better at their job, not to prove who’s the smartest person in the room.

Start With the Small Stuff That Actually Matters

Before you dive into philosophical debates about clean architecture, nail down the mechanical basics. I’ve seen too many teams get bogged down arguing about abstract principles while their actual review process resembles a game of telephone played by caffeinated squirrels.

First, establish your review checklist. Not a forty-item manifesto that nobody will read, but five to seven concrete things every reviewer should check. Does the code compile? Are there tests? Do the tests actually test something meaningful? Is the commit message clear enough that Future You won’t spend twenty minutes figuring out what Past You was thinking? These aren’t glamorous questions, but they’ll save you from the special kind of frustration that comes from approving code that breaks the build.

Second, agree on response time expectations. Nothing kills momentum quite like submitting a pull request and watching it sit there like an abandoned shopping cart in a parking lot. Set a team standard: reviews get initial feedback within 24 hours during work days. This doesn’t mean you need to provide a complete analysis in that time, but at least acknowledge that you’ve seen it and give an estimate for when you’ll have substantive feedback.

Third, decide on your approval process before you need it. How many approvals do you need? Who can approve what? Can someone approve their own revert in an emergency? These questions become significantly less fun to answer when your production system is on fire and your pull request is stuck in approval limbo because your team lead is on vacation in a country with questionable internet access.

Writing Reviews That Don’t Make People Want to Change Careers

The art of writing helpful code review comments is like the art of giving directions to someone who’s lost. You can either be the person who says “go down the road and turn at the thing,” or you can be specific, kind, and actually useful. Guess which one gets people to their destination without wanting to throw their GPS out the window.

Start your comments with context, not criticism. Instead of “This is wrong,” try “This approach might run into issues when we scale up the user base because…” You’re not just identifying problems; you’re explaining why they’re problems and helping the author understand the reasoning behind your feedback. This turns code review from a game of “spot the mistake” into a collaborative conversation about trade-offs and alternatives.

Distinguish between must-fix issues and suggestions for improvement. Use clear language like “blocking:” for things that need to change before merge, and “nit:” or “suggestion:” for nice-to-haves. This prevents reviews from becoming archaeological expeditions where the author has to excavate which comments actually need addressing and which ones are just the reviewer thinking out loud.

When you suggest changes, include examples when possible. Don’t just say “this could be more readable.” Show what more readable looks like, even if it’s just a few lines of pseudocode in your comment. The five minutes you spend writing a concrete example will save everyone thirty minutes of back-and-forth clarification.

Receiving Feedback Without Having an Existential Crisis

Getting your code reviewed feels personal because, well, it kind of is personal. You wrote that function. You crafted those variable names. You spent three hours debugging that edge case that only happens when users do something completely nonsensical but entirely predictable. When someone suggests changes, it’s natural to feel a little defensive.

The secret sauce here is reframing feedback as data collection rather than judgment. Every comment tells you something about how your code communicates its intent to other humans. If a reviewer misunderstands something, that’s not necessarily their fault or yours. It’s just information about where the communication broke down. Sometimes the fix is clearer variable names. Sometimes it’s a comment explaining the weird edge case. Sometimes it’s a conversation about whether the weird edge case should exist at all.

Respond to feedback promptly and specifically. If you make the suggested change, say so. If you disagree with a suggestion, explain why, but do it with the same level of detail you’d want if someone were disagreeing with your feedback. “I think this approach is better” isn’t helpful. “I think this approach handles the edge case on line 47 more cleanly because…” starts a conversation.

Ask questions when feedback isn’t clear. Code review comments suffer from the same ambiguity problems as any written communication. If you’re not sure what a reviewer means, ask for clarification. This isn’t admitting ignorance; it’s preventing the kind of misunderstanding that leads to three rounds of back-and-forth comments that could have been resolved with one quick conversation.

Building the Habits That Make Everything Else Work

Good code review culture is like compound interest. The daily habits seem small and unremarkable, but they accumulate into something surprisingly powerful over time. The teams I’ve worked with that have genuinely effective code review processes didn’t get there through grand gestures or revolutionary changes. They got there through boring, consistent practices that everyone actually follows.

Make small pull requests your default. I know, I know. Sometimes you need to refactor half the codebase to add a single feature. But most of the time, that 500-line pull request could be broken down into three or four smaller ones that are actually reviewable by human brains. Smaller pull requests get reviewed faster, get better feedback, and cause fewer merge conflicts. They’re also significantly easier to revert when something goes wrong, which your 3 AM self will appreciate.

Review code in your zone of expertise, but also review code outside of it. If you only review code in your immediate domain, you’ll miss opportunities to learn about other parts of the system. If you only review code outside your expertise, your feedback won’t be as useful. Mix it up. Some of your most valuable contributions might come from asking naive questions about code that does something you don’t fully understand.

The goal isn’t perfection; it’s continuous improvement. Some of the best codebases I’ve worked with have comments that acknowledge technical debt, explain temporary workarounds, and admit uncertainty about edge cases. Perfect code reviews aren’t the ones that catch every possible issue; they’re the ones that help good code become a little bit better and help everyone involved become a little bit smarter.

If you’ve made it this far, you probably have thoughts about code reviews, whether from painful experience or cautious optimism about doing them better. What’s the strangest feedback you’ve ever received in a code review, or what’s one small change your team made that improved your review culture? Drop me a line. I’m always collecting stories about the weird and wonderful ways teams figure out how to work together effectively.

Genshin Impact Five Years In: How HoYoverse Keeps the Adventure Fresh

Before getting into the details, it’s worth explaining why this particular development matters so much to tech audiences who already understand the complexities here.

Genshin Impact Five Years In: How HoYoverse Keeps the Adventure Fresh

Five Years Later, Still Getting Better

The gacha game market is packed with quality options right now. I’ve never seen this many genuinely good titles competing for attention. But somehow, Genshin Impact keeps finding ways to stay relevant among all these excellent alternatives. As Version 6.4 approaches and the game hits its fifth anniversary, it’s become something pretty rare in mobile gaming: a live service that actually got more ambitious over time instead of coasting on its early success.

Here’s what I find interesting about this timing. Why does it matter now, specifically?

The numbers help explain part of it. Over 65 million monthly players across PC, mobile, and PlayStation. It’s still one of the top ten highest-grossing mobile games globally. That kind of revenue gives HoYoverse serious resources to work with. But what they’ve done with that money is what actually matters. Instead of just keeping the lights on, they’ve kept pushing the game in new directions.

Characters We’ve Been Waiting Years to Meet

Take Varka’s recent release as a playable character. This guy has been mentioned constantly since launch but never actually appeared. The Grand Master of the Knights of Favonius was basically Genshin’s most famous no-show. His arrival feels less like another gacha banner and more like the payoff to a story thread that’s been building for years.

Most games would have rushed him out in year two to capitalize on player interest. HoYoverse waited. That patience makes all the difference between a character that feels like a cash grab and one that feels earned. The Genshin Impact official team has figured out that some rewards get better when you make people wait for them.

Nod Krai Changes How We Think About New Regions

New areas have always been Genshin’s bread and butter, but Nod Krai does something different. Earlier regions mostly gave us variations on climbing, gliding, and puzzle-solving. Nod Krai introduces mechanics that feel fresh even after five years of exploration.

What I appreciate is how much trust the developers are showing in their players now. Early regions walked you through every new concept. Nod Krai assumes you know what you’re doing and throws you into more complex environmental storytelling and traversal challenges. It reflects how the community has grown from beginners figuring out elemental reactions to veterans who want systems that really test their skills.

The region connects naturally to the rest of Teyvat without feeling tacked on. It’s like finding a part of the world that was always there, waiting to be discovered. Players digging into all the details should check out the Genshin wiki and guides community, which has already started documenting the complex interactions that make exploration so satisfying.

User-Generated Content and Surprising Partnerships

Version Luna II brought user-generated content tools that actually change how people play. These aren’t just cosmetic customization options. Players can design challenges, share exploration routes, and create their own narrative experiences. After five years, the most dedicated players have developed genuine expertise. These tools give them somewhere to channel it.

The implementation is smart too. Instead of overwhelming people with complex creation suites, HoYoverse focused on intuitive tools that anyone can pick up but still offer depth for ambitious projects. Early community creations show just how much potential this system has to keep the game alive basically forever.

Then there’s the Duolingo collaboration, which honestly caught me off guard. Connecting language learning with adventure rewards is the kind of creative thinking that keeps old games feeling fresh. It adds real value for players while pulling Genshin into conversations beyond gaming. Not every crossover needs to be another anime tie-in.

What This Means for Live Service Games

Genshin Impact’s five-year run teaches some important lessons about sustainable live service design. The secret isn’t flashy overhauls or constant reinvention. It’s consistent quality improvements and respecting the time players have already invested. Every major update builds on previous content instead of replacing it. Growth instead of resets.

Look at how they handle power creep. New characters and weapons add options without making your existing investments worthless. That balance requires careful design work, but it creates a healthier ecosystem where people feel safe committing long-term. Five years later, launch characters are still viable and beloved. New additions expand possibilities rather than forcing upgrades.

As the fifth anniversary approaches, Genshin Impact proves that ambitious live service games can stick to their vision while continuing to grow. Patient storytelling, thoughtful feature additions, and genuine respect for community creativity have created something rare in mobile gaming: a world that actually feels worth living in for years. In an industry often criticized for chasing short-term revenue over long-term player satisfaction, Genshin Impact shows there’s a better way to do this.

The bigger picture connecting gaming trends, mobile entertainment, and digital culture is exactly what metatrend.app maps. If the questions this piece raises matter to you, that is a good place to continue the conversation.

If you work in or around this space, the practical implications are worth mapping against your current tooling and roadmap. Try it yourself — the repo is linked above.

The Git Hook That Saved My Sanity: Why commitizen-tools Is Your New Best Friend

The Problem With Good Intentions and Terrible Commit Messages

We’ve all been there. It’s 2:47 AM, you’ve finally squashed that bug that’s been haunting the production logs for three days, and you type “git commit -m ‘fix stuff’”. Your future self will hate you for this. Your teammates will hate you for this. The poor soul doing archaeology on the codebase six months from now will definitely hate you for this.

The Git Hook That Saved My Sanity: Why commitizen-tools Is Your New Best Friend

I spent the better part of a decade watching smart engineers write commit messages that looked like they’d been composed by caffeinated squirrels. “wip”, “updates”, “fix fix fix”, and my personal favorite, “THIS BETTER WORK OR I’M SWITCHING TO FARMING”. These messages tell you nothing about what actually changed, why it changed, or whether that change might be the reason your deployment is currently on fire.

The conventional wisdom says to write better commit messages manually. Set up templates. Send stern Slack reminders. Write wiki pages about commit message standards that nobody reads. I tried all of this. It works for about two weeks until the next crunch deadline hits and everyone reverts to their primal commit message instincts.

Illustration for The Git Hook That Saved My Sanity: Why commitizen-tools Is Your New Best Friend

Enter commitizen-tools: The Gentle Dictator of Your Git Workflow

Here’s where commitizen-tools comes in like a well-dressed bouncer at an exclusive club. It’s a Python package that turns your chaotic commit process into something that actually resembles professional software development. Instead of typing random thoughts into commit messages, it walks you through a structured format that has real meaning.

The magic happens through interactive prompts that guide you through the conventional commit format. Type “cz commit” instead of “git commit” and you get a friendly interrogation: What type of change is this? What scope does it affect? Give me a short description. Any breaking changes? It’s like having a very patient senior developer sitting next to you, making sure you don’t embarrass yourself in the commit log.

But here’s the real genius part that sold me on this tool. It doesn’t just format your messages nicely. It integrates with automated changelog generation and semantic versioning. Those perfectly structured commits become the foundation for automated release notes that actually tell a coherent story about what shipped.

The Setup That Actually Sticks

Getting commitizen-tools running is refreshingly straightforward for a developer tool. Install it with pip, initialize it in your project with “cz init”, and you’re basically done. The default configuration works well enough that you can start using it immediately, though you’ll probably want to customize the scopes to match your project structure.

The real power move is setting up the pre-commit hook. Add commitizen to your pre-commit configuration and suddenly every commit gets validated automatically. No more commits that slip through with malformed messages. No more debates about whether “feat” or “feature” is the right prefix. The tool enforces consistency without requiring human memory or discipline.

I’ve watched teams adopt this setup and actually stick with it because it makes the process easier, not harder. When doing the right thing requires less effort than doing the wrong thing, adoption becomes inevitable. The interactive prompts remove the mental overhead of remembering format rules, and the validation catches mistakes before they become permanent embarrassments.

Beyond Pretty Messages: The Automation Payoff

Here’s where commitizen-tools stops being just another formatting tool and becomes genuinely transformative for your workflow. Those structured commits become machine-readable metadata that drives your entire release process. Run “cz bump” and it automatically increments version numbers based on the types of commits since the last release. Features bump minor versions, fixes bump patch versions, breaking changes bump major versions.

The changelog generation is where this really shines. Instead of manually combing through git logs trying to remember what actually shipped in each release, “cz changelog” builds perfectly formatted release notes automatically. Features get grouped together, bug fixes are listed separately, and breaking changes get the prominent warnings they deserve. Your product manager will love you for this.

I’ve seen this change how teams think about releases. When generating release notes takes thirty seconds instead of thirty minutes, you ship more frequently. When version bumping is automated and reliable, you stop batching changes into massive releases that are impossible to debug when something goes wrong. The tool doesn’t just improve your commit messages, it improves your entire delivery cadence.

The Subtle Art of Developer Experience

What really sets commitizen-tools apart from other commit message tools is how thoughtfully it handles the developer experience. The prompts are fast enough that they don’t interrupt flow state, but comprehensive enough to capture all the context you need. The validation is strict enough to maintain standards but flexible enough to handle edge cases without requiring a PhD in regex.

The tool integrates smoothly with existing workflows. Your CI pipeline can validate commit messages automatically. Your IDE plugins work normally. Your git aliases still function. It enhances your existing process without requiring you to throw out muscle memory built over years of development.

There’s something deeply satisfying about looking at a commit history generated with commitizen-tools. Every message follows the same clear format. The progression of features and fixes tells a coherent story. When you need to track down when a particular change was introduced, you can actually find it without spelunking through cryptic one-word commit messages.

After watching too many talented developers struggle with the mundane but critical task of writing coherent commit messages, finding a tool that solves this problem elegantly feels like discovering a cheat code for software development. If you’ve been putting off improving your commit message discipline because it feels like pointless bureaucracy, commitizen-tools might just change your mind about what good tooling can accomplish.

Why Your Database is Slow (And Why Adding More RAM Won’t Fix It)

I watched a developer throw 64GB of RAM at a PostgreSQL instance last month, convinced that more memory would solve their query timeout problems. The queries still timed out. The real culprit was a missing index on a join condition that forced a sequential scan through 50 million rows. This scenario plays out in production environments everywhere, because we’ve been conditioned to believe that hardware fixes software problems.

Database performance isn’t a hardware problem disguised as a software problem. It’s usually a design problem disguised as a performance problem. After debugging enough 3 AM database meltdowns, you learn to look past the obvious metrics and dig into the actual execution patterns that kill performance.

Index Strategy Beyond the Obvious

Everyone knows to index their primary keys and foreign keys. The real performance gains come from composite indexes that align with your actual query patterns. I’ve seen applications create separate indexes on `user_id`, `created_at`, and `status` columns, then wonder why queries filtering on all three conditions still crawl.

The magic happens when you create a composite index like `(user_id, status, created_at)` that matches your WHERE clause order. PostgreSQL can use this single index to satisfy complex queries without touching the table data at all. But here’s the catch: column order matters. Put the most selective column first, unless you have specific query patterns that benefit from a different arrangement.

Partial indexes take this further by only indexing rows that meet specific conditions. If 90% of your orders have status ‘completed’ but you only query active orders, create an index like `CREATE INDEX ON orders (user_id, created_at) WHERE status != ‘completed’`. Your index becomes smaller, faster, and more cache-friendly.

Query Execution Plans Tell the Real Story

The EXPLAIN ANALYZE output is your database’s confession about what went wrong. When PostgreSQL shows a Hash Join with a cost of 50,000 and actual time of 2.3 seconds, that’s not a suggestion for optimization. That’s a cry for help.

Look for sequential scans on large tables first. A Seq Scan on a 10-million-row table means your query couldn’t find a usable index. Next, check for nested loops with high iteration counts. A Nested Loop showing “loops=10000” indicates a missing join index that’s forcing the database to repeatedly scan inner tables.

The buffers section reveals I/O patterns that hardware can’t fix. If you see “read=50000 hit=500”, your query is reading 50,000 disk blocks but only finding 500 in cache. No amount of RAM will help if your query design forces disk reads on every execution. This usually points to queries that can’t use existing indexes effectively.

Connection Pooling and the Overhead Nobody Talks About

Application developers love creating database connections like they’re free. Each PostgreSQL connection eats about 10MB of memory and requires its own process. When your application spawns 200 connections to handle concurrent requests, you’ve just burned through 2GB before executing a single query.

PgBouncer solves this with connection pooling, but the configuration details matter more than the tool choice. Transaction-level pooling works for most applications and allows connection reuse between transactions. Session-level pooling maintains connection state but limits scalability. Statement-level pooling gives you maximum efficiency but breaks applications that rely on prepared statements or temporary tables.

The real performance killer is connection churn. Applications that open connections, execute single queries, and close connections create massive overhead. Each connection establishment requires TCP handshaking, authentication, and process creation. A properly configured connection pool reduces this overhead by maintaining persistent connections that handle multiple requests.

Normalization Versus Denormalization in Practice

Database textbooks preach third normal form like it’s gospel, but production systems tell a different story. I’ve seen perfectly normalized schemas that require 8-table joins for simple product listings, turning straightforward queries into performance nightmares.

Strategic denormalization can eliminate expensive joins by storing calculated values directly in frequently queried tables. Instead of joining orders, order_items, and products tables to calculate order totals, store the total directly in the orders table. Yes, this creates data redundancy, but it also eliminates joins that scale poorly as data grows.

The trick is identifying your application’s core query patterns and optimizing for those specifically. If 80% of your queries need user names along with user IDs, consider storing the name in related tables instead of forcing constant joins to the users table. This trades storage space for query performance, a trade-off that usually favors performance in read-heavy applications.

Monitoring What Actually Matters

Database monitoring tools love showing colorful graphs of CPU usage and memory consumption, but these metrics tell you what happened, not why it happened. The most valuable metrics are often buried in database-specific views that require actual SQL knowledge to interpret.

PostgreSQL’s pg_stat_statements extension reveals which queries consume the most total time in your application. A query that runs 10,000 times per hour with 50ms average execution time has a bigger performance impact than a query that runs once with 10-second execution time. Focus optimization efforts on high-frequency queries first.

Lock contention shows up in pg_locks and pg_stat_activity views as queries waiting for lock acquisition. When you see multiple sessions waiting on AccessShareLock or RowExclusiveLock, you’ve found a serialization bottleneck that connection pooling and hardware upgrades can’t solve. This usually requires application-level changes to reduce lock scope or duration.

The next time someone suggests throwing more hardware at a slow database, ask them to show you the execution plans first. Database performance problems have roots in query design, index strategy, and connection management. These software problems require software solutions, not hardware band-aids.