Category: Uncategorized

Stop Choosing Frontend Frameworks Like You’re Picking a Favorite Child

The Architecture Theater We Keep Performing

I’ve watched teams spend six months debating React versus Vue versus Angular like they’re choosing a life partner, only to ship a glorified CRUD app that could have been built with vanilla JavaScript and a good night’s sleep. The truth nobody wants to admit is that most framework architecture decisions happen in a vacuum, divorced from the actual problems they’re meant to solve.

The real kicker? We’ve created this elaborate performance where everyone pretends bundle size matters when your app loads 47 different analytics scripts. We obsess over virtual DOM performance while making API calls that would make a dial-up modem weep. The cognitive dissonance is beautiful in its absurdity.

Let’s cut through the architectural evangelism and look at what these frameworks actually do well, where they face-plant spectacularly, and why your choice probably matters less than you think.

React’s Elegant Chaos

React won the mindshare war not because it’s technically superior, but because it made complexity feel manageable. The component model maps beautifully to how developers actually think about UI, even if the implementation sometimes feels like solving a Rubik’s cube blindfolded. JSX looks weird until you realize it’s just JavaScript wearing HTML’s clothes to a costume party.

The ecosystem is React’s secret weapon and its Achilles heel. Need state management? Choose from Redux, Zustand, Jotai, or seventeen other options that all solve slightly different problems. Want to handle forms? React Hook Form, Formik, or roll your own solution with useState and prayer. This flexibility is intoxicating until you’re three months into a project and realize your team has invented their own dialect of React.

Where React truly shines is in large codebases with multiple teams. The component boundaries create natural ownership lines, and the unidirectional data flow makes debugging production issues less like archaeology and more like detective work. The fiber architecture handles complex update scenarios with the grace of a Swiss watch, even when developers treat it like a sledgehammer.

The performance story is complicated. React’s default behavior is to re-render everything and let the virtual DOM sort it out, which works until it doesn’t. Memo, useMemo, and useCallback become your best friends and worst enemies simultaneously. You’ll spend more time optimizing React than you’d like to admit, but at least the tools exist.

Vue’s Deceptive Simplicity

Vue presents itself as the reasonable choice, the framework equivalent of a well-engineered Toyota. It handles the common cases beautifully, has excellent documentation, and won’t surprise you with breaking changes every Tuesday. The template syntax feels familiar to anyone who’s touched HTML, and the reactivity system just works without requiring a computer science degree.

Composition API finally gave Vue the architectural tools it needed for complex applications. Before Vue 3, watching teams try to scale Options API codebases was like watching someone build a skyscraper with Lego blocks. Possible, but painful. The new reactive primitives are genuinely well-designed, offering fine-grained reactivity without the overhead of a virtual DOM.

The trade-off is ecosystem maturity. React’s massive community means someone has already solved your weird edge case and published it on npm. Vue’s smaller ecosystem means more greenfield development, which can be refreshing or terrifying depending on your deadline. The tooling story has improved dramatically with Vite, but you’re still not getting the same level of third-party integration options.

Vue’s real strength is in teams that value convention over configuration. The framework makes reasonable assumptions about how you want to structure your application, and fighting those assumptions feels wrong. This works brilliantly until you need to do something genuinely novel, at which point you’re reading source code and questioning your life choices.

Angular’s Enterprise Theater

Angular is what happens when you take Java architectural patterns and force them into JavaScript’s free-spirited world. The result is either beautiful enterprise-grade structure or an overcomplicated mess, depending on your tolerance for dependency injection and decorators. TypeScript isn’t optional here, it’s the entire point.

The CLI tooling is genuinely impressive. Angular’s build system, testing setup, and code generation capabilities are years ahead of the React ecosystem’s fragmented approach. When everything works, Angular feels like developing in a sophisticated IDE rather than cobbling together webpack configurations and hoping for the best.

Zone.js is Angular’s secret sauce and its performance albatross. Automatic change detection sounds magical until you’re debugging why your component re-rendered 47 times because someone called Date.now() in a loop. OnPush change detection strategy becomes mandatory for any application that values performance over developer convenience.

The learning curve is steep, but the payoff is substantial for large teams. Angular’s opinionated structure means codebases tend to look similar across teams and projects. This consistency is invaluable when you’re onboarding developers or maintaining applications over multiple years. The architecture scales well, assuming you have the budget for senior developers who understand the framework’s philosophical underpinnings.

The Framework Decision That Actually Matters

Here’s the uncomfortable truth: your framework choice will have less impact on your project’s success than your team’s discipline around state management, component boundaries, and testing practices. I’ve seen elegant Vue applications and horrifying React codebases, often built by the same developers six months apart.

The real architectural decision is whether you’re building for today’s requirements or tomorrow’s unknowns. React’s flexibility works for teams that expect significant pivots. Vue’s conventions work brilliantly for teams that understand their domain. Angular’s structure pays dividends for long-lived enterprise applications with multiple development teams.

Performance comparisons are largely academic unless you’re building applications with genuinely complex interaction models. Most web applications spend more time waiting for network requests than rendering DOM updates. Focus on your data loading strategies, caching layer, and bundle optimization before micro-optimizing component render cycles.

The most honest advice I can give is to pick the framework your team can maintain effectively. A well-structured Vue application will outperform a poorly architected React application every time. The framework is just the foundation, the building quality depends entirely on the builders.

What architectural decisions have you regretted most in your frontend projects? I’m genuinely curious about the war stories that shaped your framework preferences, especially the ones that made you question everything you thought you knew about web development.


Why Your REST API Probably Sucks (And How to Fix It Without Rewriting Everything)

The Cargo Cult of RESTful Design

After fifteen years of watching developers religiously append “/api/v1/” to every endpoint while completely missing the point of REST, I’ve concluded that most APIs are about as RESTful as a Windows ME installation. We’ve created a generation of developers who think slapping HTTP verbs on CRUD operations makes them architectural purists, when in reality they’re building glorified RPC calls with better marketing.

Why Your REST API Probably Sucks (And How to Fix It Without Rewriting Everything)

The real problem isn’t that REST is hard to implement correctly. It’s that most teams never bothered to understand what they were actually trying to achieve. They cargo-culted the syntax without grasping the semantics. You end up with endpoints like `POST /api/users/123/activate` instead of `PATCH /api/users/123` with `{“status”: “active”}`, because someone read that POST means “create” in a blog post five years ago and never questioned it again.

Richardson’s Maturity Model exists for a reason, yet I’ve seen enterprise APIs stuck at Level 1 while their architects debate whether to use GraphQL. Before you chase the next shiny framework, maybe consider whether your current API actually follows HTTP semantics. Spoiler alert: it probably doesn’t.

Illustration for Why Your REST API Probably Sucks (And How to Fix It Without Rewriting Everything)

The Idempotency Delusion

Let’s talk about idempotency, because apparently half the industry thinks it means “won’t break if you call it twice.” Wrong. Idempotency means you can call an operation multiple times and get the same result every time, not just that it won’t explode your database. Yet I regularly encounter APIs where `PUT /users/123` increments a login counter or `DELETE /orders/456` sends another cancellation email to the customer.

This matters more than your product manager thinks. When your mobile app retries a failed request because of spotty network conditions, true idempotency means users don’t accidentally charge themselves twice for that premium subscription. When your microservices handle thousands of requests per second with occasional timeouts, idempotent operations let you implement safe retry logic without complex distributed locking mechanisms.

Here’s a simple test: if you can’t safely wrap every API call in a retry loop with exponential backoff, your operations aren’t properly idempotent. Fix this before you scale, or prepare to debug some truly spectacular race conditions at 3 AM when your traffic spikes.

Pagination: The Performance Killer Nobody Talks About

Offset-based pagination is the technical debt that keeps on giving. You know the pattern: `GET /api/posts?page=1000&limit=20` that takes forty seconds to execute because your database has to count and skip 19,980 records. Every team implements it, every team eventually regrets it, yet somehow we keep teaching it in tutorials like it’s best practice.

Cursor-based pagination isn’t just theoretically better, it’s practically essential once you hit any meaningful scale. Instead of asking for page 1000, you ask for the next 20 records after a specific cursor value. Your database can use indexes efficiently, response times stay consistent regardless of offset, and you don’t have to explain to stakeholders why the search results page crashes when users click beyond page 50.

The implementation shift is straightforward: replace `page` and `limit` with `cursor` and `count`, return a `next_cursor` in your response envelope, and update your client code to track cursors instead of page numbers. Yes, it breaks the mental model of “jumping to page 10,” but your users will thank you when the interface actually loads instead of timing out. Sometimes the right technical decision requires breaking a familiar but fundamentally flawed user experience.

Versioning Strategies That Don’t Completely Suck

API versioning brings out the worst in engineering teams. Half want to version in the URL because it’s “explicit,” the other half insist on headers because it’s “cleaner.” Meanwhile, both approaches miss the fundamental question: why are you versioning at all? Most breaking changes happen because teams never designed for extensibility in the first place.

Semantic versioning works well for libraries, but APIs are different beasts. Your v2.1.3 doesn’t mean much when a single field type change can break every client integration. Instead, version by compatibility contract. Major versions for breaking changes, minor versions for backward-compatible additions, and patch versions for bug fixes that don’t change behavior. Document what constitutes a breaking change upfront, because “we added a required field” shouldn’t surprise anyone six months later.

Here’s the part that might upset you: URL versioning actually works better in practice than header-based versioning, despite what the purists say. Developers can see the version in logs, curl commands work without extra headers, and debugging becomes trivial. Yes, it couples versioning to resource identification, but that coupling often reflects reality better than pretending versions are just metadata. Sometimes pragmatism trumps theoretical purity, especially when you’re supporting dozens of client applications with different upgrade cycles.

Error Handling Beyond HTTP Status Codes

HTTP status codes are necessary but insufficient for meaningful error communication. Returning “400 Bad Request” tells me exactly nothing about whether I sent invalid JSON, missing required fields, or data that failed business validation. Yet I regularly encounter APIs where every client error gets the same generic 400 response, leaving developers to guess what went wrong based on context clues.

Structured error responses solve this problem without inventing new protocols. Include an error code that’s stable across versions, a human-readable message that explains what happened, and enough context for clients to either fix the request automatically or present meaningful feedback to users. Something like `{“error”: “VALIDATION_FAILED”, “message”: “Email address is required”, “field”: “email”}` gives clients everything they need to handle the error appropriately.

The error code stays constant even if you change the message text, field validation can highlight specific problems in forms, and your support team can actually help users when they forward error messages instead of just saying “something went wrong.” It’s a small investment that pays dividends every time someone tries to integrate with your API without reading documentation that may or may not exist.

Good API design isn’t about following every best practice you read online. It’s about understanding what constraints your system operates under and making deliberate tradeoffs that optimize for the problems you actually have. What patterns have you found that work well in practice, even if they wouldn’t win any architectural purity contests?

Container Orchestration: Why Your Kubernetes Setup Probably Sucks (And How to Fix It)

The Great Orchestration Theater

Let me paint you a familiar picture. Your engineering team decides they need “cloud native” infrastructure because someone read a Medium article about Netflix’s deployment pipeline. Six months later, you’re staring at a Kubernetes cluster that requires three full-time engineers to maintain, costs more than your previous VM setup, and somehow makes deployments slower than when you just rsync’d files to a box. Welcome to the wonderful world of cargo cult orchestration.

The dirty secret nobody talks about at KubeCon is that most organizations running container orchestration platforms are doing it wrong. Not slightly wrong or “could use some optimization” wrong. Catastrophically, expensively, hair-pullingly wrong. They’ve taken a powerful tool designed to solve specific scaling and reliability problems and turned it into an elaborate Rube Goldberg machine that creates more problems than it solves.

The real tragedy isn’t the wasted money or engineering cycles. It’s that when done correctly, container orchestration is one of the most elegant solutions to distributed systems problems we’ve ever developed. But elegance requires understanding, and understanding requires acknowledging that your current setup probably looks like a house of cards built during an earthquake.

The Resource Allocation Comedy Hour

Here’s where things get mathematically ridiculous. I’ve audited dozens of Kubernetes clusters over the years, and the pattern is depressingly consistent: resource requests set to fractions of what applications actually need, limits configured by someone who apparently believes RAM grows on trees, and scheduling policies that would make a Vegas casino proud of their randomness. The result? Clusters running at 15% utilization while developers complain about pods getting killed by the OOM reaper.

The fundamental misunderstanding starts with treating resource allocation like a configuration file instead of a capacity planning exercise. Your application needs 2GB of RAM to function properly, but someone sets the request to 512MB “to be efficient” and the limit to 4GB “just in case.” What you’ve created is a scheduling lottery where your application might get the resources it needs or might spend its short life swapping itself to death.

Vertical Pod Autoscaling was supposed to solve this problem by automatically adjusting resource requests based on actual usage patterns. Instead, it’s become another layer of complexity that most teams configure once, watch fail spectacularly, then disable forever. The real solution requires actually understanding your application’s resource consumption patterns, which means monitoring, profiling, and doing the boring work that doesn’t generate conference talks.

The networking layer adds another dimension of creative chaos. I’ve seen clusters where pod-to-pod communication requires three network hops, two load balancers, and a service mesh that nobody fully understands. Traffic that should take microseconds ends up with latencies measured in tens of milliseconds because someone read that microservices need “proper service discovery” and proceeded to implement the enterprise version of playing telephone.

Deployment Strategies That Actually Work

Let’s talk about deployment strategies that don’t make you question your career choices. Blue-green deployments sound simple in theory: maintain two identical production environments and switch traffic between them. In practice, most implementations forget about shared state, database migrations, and the fact that “identical” environments are harder to maintain than identical snowflakes. You end up with deployments that work perfectly until they encounter data that doesn’t exist in both environments or external dependencies that don’t appreciate sudden traffic pattern changes.

Rolling deployments offer a more pragmatic approach, but only if you design your applications with gradual rollouts in mind. This means implementing proper health checks that actually verify your application can serve traffic, not just that the process is running. It means designing database migrations that work with both old and new code versions simultaneously. It means accepting that deployment complexity should live in your application design, not in increasingly elaborate orchestration scripts.

Canary deployments are the evolution of rolling strategies, but they require sophisticated traffic management and monitoring capabilities that most organizations lack. You can’t just route 5% of traffic to a new version and hope for the best. You need request-level metrics, error rate tracking, and automated rollback mechanisms that trigger faster than a human can type “kubectl rollback.” Without this foundation, canary deployments become elaborate ways to impact exactly 5% of your users when things go wrong.

The Observability Puzzle

Observability in containerized environments isn’t just important, it’s the difference between running a distributed system and running a distributed disaster. Traditional monitoring approaches fall apart when your application instances appear and disappear faster than a magician’s assistant. Log aggregation becomes an exercise in correlation across ephemeral containers with rotating IP addresses. Metrics collection turns into a game of whack-a-mole with short-lived processes that disappear before your monitoring system notices them.

The three pillars of observability (metrics, logs, and traces) need fundamental rethinking in orchestrated environments. Metrics must be container-aware and understand the relationship between resource consumption and application performance. Logs need structured formatting and correlation IDs that persist across container restarts and service boundaries. Distributed tracing becomes mandatory rather than optional when your simple API call might traverse six different services running across three different nodes.

Most organizations approach observability as an afterthought, bolting monitoring onto their orchestration platform like a trailer hitch on a sports car. Effective observability requires designing your applications and infrastructure with monitoring in mind from day one. This means instrumenting your code, standardizing on log formats, and accepting that observability infrastructure might cost more than your actual application infrastructure. The alternative is debugging production issues with the observability equivalent of a flashlight with dying batteries.

Building Something That Actually Works

Here’s the uncomfortable truth: most container orchestration problems stem from treating Kubernetes like a magic deployment wand instead of understanding it as a platform for building distributed systems. Start with your application architecture. Design services that can handle partial failures, implement proper circuit breakers, and build health checks that mean something. Only then does orchestration become a solution rather than an expensive way to distribute your architectural problems across more machines.

Effective orchestration strategies require discipline around configuration management, resource allocation, and deployment practices. Use infrastructure as code not because it’s trendy, but because manually configured clusters are debugging nightmares waiting to happen. Implement proper RBAC policies not for compliance theater, but because security boundaries matter when your cluster runs production workloads. Design your CI/CD pipelines to fail fast and provide clear feedback, not to hide deployment complexity behind increasingly elaborate automation.

The goal isn’t to build the most sophisticated orchestration platform possible. The goal is to build a platform that makes deploying and operating your applications boringly reliable. Boring is good. Boring means you can focus on building features instead of debugging why your deployment pipeline requires a PhD in YAML archaeology to understand.

What orchestration challenges are you wrestling with in your infrastructure? I’m particularly interested in hearing about deployment strategies that work well in practice versus those that look great in documentation but fall apart under real-world conditions.

Container Orchestration: Why Your Kubernetes Setup Probably Sucks (And How to Fix It)

The Great Orchestration Theater

Let me paint you a familiar picture. Your engineering team decides they need “cloud native” infrastructure because someone read a Medium article about Netflix’s deployment pipeline. Six months later, you’re staring at a Kubernetes cluster that requires three full-time engineers to maintain, costs more than your previous VM setup, and somehow makes deployments slower than when you just rsync’d files to a box. Welcome to the wonderful world of cargo cult orchestration.

The dirty secret nobody talks about at KubeCon is that most organizations running container orchestration platforms are doing it wrong. Not slightly wrong or “could use some optimization” wrong. Catastrophically, expensively, hair-pullingly wrong. They’ve taken a powerful tool designed to solve specific scaling and reliability problems and turned it into an elaborate Rube Goldberg machine that creates more problems than it solves.

The real tragedy isn’t the wasted money or engineering cycles. It’s that when done correctly, container orchestration is one of the most elegant solutions to distributed systems problems we’ve ever developed. But elegance requires understanding, and understanding requires admitting that your current setup probably looks like a house of cards built during an earthquake.

The Resource Allocation Comedy Hour

Here’s where things get mathematically ridiculous. I’ve audited dozens of Kubernetes clusters over the years, and the pattern is depressingly consistent: resource requests set to fractions of what applications actually need, limits configured by someone who apparently believes RAM grows on trees, and scheduling policies that would make a Vegas casino proud of their randomness. The result? Clusters running at 15% utilization while developers complain about pods getting killed by the OOM reaper.

The misunderstanding starts with treating resource allocation like a configuration file instead of a capacity planning exercise. Your application needs 2GB of RAM to function properly, but someone sets the request to 512MB “to be efficient” and the limit to 4GB “just in case.” What you’ve created is a scheduling lottery where your application might get the resources it needs or might spend its short life swapping itself to death.

Vertical Pod Autoscaling was supposed to solve this problem by automatically adjusting resource requests based on actual usage patterns. Instead, it’s become another layer of complexity that most teams configure once, watch fail spectacularly, then disable forever. The real solution requires actually understanding your application’s resource consumption patterns, which means monitoring, profiling, and doing the boring work that doesn’t generate conference talks.

The networking layer adds another dimension of creative chaos. I’ve seen clusters where pod-to-pod communication requires three network hops, two load balancers, and a service mesh that nobody fully understands. Traffic that should take microseconds ends up with latencies measured in tens of milliseconds because someone read that microservices need “proper service discovery” and proceeded to implement the enterprise version of playing telephone.

Deployment Strategies That Actually Work

Let’s talk about deployment strategies that don’t make you question your career choices. Blue-green deployments sound simple in theory: maintain two identical production environments and switch traffic between them. In practice, most implementations forget about shared state, database migrations, and the fact that “identical” environments are harder to maintain than identical snowflakes. You end up with deployments that work perfectly until they encounter data that doesn’t exist in both environments or external dependencies that don’t appreciate sudden traffic pattern changes.

Rolling deployments offer a more pragmatic approach, but only if you design your applications with gradual rollouts in mind. This means implementing proper health checks that actually verify your application can handle traffic, not just that the process is running. It means designing database migrations that work with both old and new code versions simultaneously. It means accepting that deployment complexity should live in your application design, not in increasingly elaborate orchestration scripts.

Canary deployments sound like the evolution of rolling strategies, but they require sophisticated traffic management and monitoring capabilities that most organizations lack. You can’t just route 5% of traffic to a new version and hope for the best. You need request-level metrics, error rate tracking, and automated rollback mechanisms that trigger faster than a human can type “kubectl rollback.” Without this foundation, canary deployments become elaborate ways to impact exactly 5% of your users when things go wrong.

The Observability Puzzle

Observability in containerized environments isn’t just important, it’s the difference between running a distributed system and running a distributed disaster. Traditional monitoring approaches fall apart when your application instances appear and disappear faster than a magician’s assistant. Log aggregation becomes an exercise in correlation across temporary containers with rotating IP addresses. Metrics collection turns into a game of whack-a-mole with short-lived processes that disappear before your monitoring system notices them.

The three pillars of observability (metrics, logs, and traces) need complete rethinking in orchestrated environments. Metrics must be container-aware and understand the relationship between resource consumption and application performance. Logs need structured formatting and correlation IDs that persist across container restarts and service boundaries. Distributed tracing becomes mandatory rather than optional when your simple API call might traverse six different services running across three different nodes.

Most organizations approach observability as an afterthought, bolting monitoring onto their orchestration platform like a trailer hitch on a sports car. Effective observability requires designing your applications and infrastructure with monitoring in mind from day one. This means instrumenting your code, standardizing on log formats, and accepting that observability infrastructure might cost more than your actual application infrastructure. The alternative is debugging production issues with the observability equivalent of a flashlight with dying batteries.

Building Something That Actually Works

Here’s the uncomfortable truth: most container orchestration problems come from treating Kubernetes like a magic deployment wand instead of understanding it as a platform for building distributed systems. Start with your application architecture. Design services that can handle partial failures, implement proper circuit breakers, and build health checks that mean something. Only then does orchestration become a solution rather than an expensive way to distribute your architectural problems across more machines.

Effective orchestration strategies require discipline around configuration management, resource allocation, and deployment practices. Use infrastructure as code not because it’s trendy, but because manually configured clusters are debugging nightmares waiting to happen. Implement proper RBAC policies not for compliance theater, but because security boundaries matter when your cluster runs production workloads. Design your CI/CD pipelines to fail fast and provide clear feedback, not to hide deployment complexity behind increasingly elaborate automation.

The goal isn’t to build the most sophisticated orchestration platform possible. The goal is to build a platform that makes deploying and operating your applications boringly reliable. Boring is good. Boring means you can focus on building features instead of debugging why your deployment pipeline requires a PhD in YAML archaeology to understand.

What orchestration challenges are you wrestling with in your infrastructure? I’m particularly interested in hearing about deployment strategies that work well in practice versus those that look great in documentation but fall apart under real-world conditions.

Your First Security Vulnerability Hunt: A Field Guide for New Engineers

Why Your Shiny New Stack Already Has Problems

Every modern application stack ships with vulnerabilities. This isn’t a conspiracy or a sign that we’re all terrible engineers. It’s just math. Your React frontend pulls in 1,247 dependencies through npm. Your Express backend imports another 400. That Postgres database you’re running? It’s 25 years old and has accumulated features like a Victorian mansion accumulates ghosts. Each piece of this beautiful, complex machine represents thousands of decisions made by humans who were probably tired and definitely had incomplete information.

Your First Security Vulnerability Hunt: A Field Guide for New Engineers

The good news is that most vulnerabilities follow predictable patterns. Once you know where to look, finding them becomes less like hunting unicorns and more like collecting Pokemon cards. The difference is that these particular cards can crash your production environment at 2 AM on a Friday.

Before we start hunting, let’s establish something important. Security isn’t about building an impenetrable fortress. It’s about making your application harder to compromise than the one next door. Think of it as cybersecurity Darwinism: you don’t need to outrun the bear, you just need to outrun the other camper.

Illustration for Your First Security Vulnerability Hunt: A Field Guide for New Engineers

The Low-Hanging Fruit That Actually Matters

Start with dependency scanning because it requires zero security expertise and catches real problems. Install a tool like npm audit or Safety for Python. These tools check your dependencies against known vulnerability databases and flag anything sketchy. Yes, they’ll produce false positives that make you question your life choices. Yes, updating that one library will break three other things in ways that defy physics. But you’ll also catch legitimate issues that attackers already know about.

The real magic happens when you automate this process. Add dependency scanning to your CI pipeline and make it block deploys when it finds high-severity issues. This sounds harsh until you realize that most vulnerability fixes are literally one-line version bumps. The alternative? Explaining to your team lead why someone used a publicly known exploit to access your user database.

Focus on vulnerabilities with CVSS scores above 7.0 and ignore the rest until you’ve built the muscle memory. A perfect security posture is the enemy of a functioning one. You’re not trying to achieve theoretical perfection. You’re trying to avoid being the low-hanging fruit in someone else’s automated scanning script.

Input Validation: Where Good Intentions Go to Die

Every application accepts user input. Every piece of user input is a potential attack vector. This includes form fields, URL parameters, file uploads, API payloads, and that innocent-looking search box that definitely won’t be used to inject SQL commands. The fundamental rule is simple: never trust data that comes from outside your application boundary. The implementation is where things get messy.

Start by building a simple input validation layer for your API endpoints. Use a schema validation library like Joi for Node.js or Marshmallow for Python. Define exactly what valid input looks like for each endpoint, then reject everything else. This catches obvious injection attempts and makes your API more predictable for legitimate users. It’s defensive programming with benefits.

The real education happens when you start thinking like an attacker. Take your contact form and try submitting a single quote character. Watch what happens to your database query. Try uploading a file named ../../../etc/passwd and see where it lands on your filesystem. These experiments will teach you more about security than any theoretical discussion about threat models.

Remember that client-side validation is for user experience, not security. JavaScript validation can be disabled with developer tools. Client-side limits can be bypassed by crafting HTTP requests directly. Always validate on the server side, even if it feels repetitive. The browser is not part of your security perimeter.

Authentication: The Art of Proving You Are Who You Say You Are

Authentication is like plumbing: when it works, nobody thinks about it, and when it breaks, everyone becomes an expert. The good news? You don’t need to build your own authentication system from scratch. The bad news? Integrating existing solutions still gives you plenty of opportunities for spectacular failures.

If you’re building something new, start with an established authentication provider like Auth0, AWS Cognito, or Firebase Auth. These services handle the complex parts like password hashing, session management, and multi-factor authentication. They also provide OAuth integrations so users can sign in with existing accounts. This approach feels like cheating until you realize that authentication security is not where you want to demonstrate your creativity.

The critical implementation detail is how you handle tokens on the frontend. JSON Web Tokens should live in httpOnly cookies, not localStorage. localStorage is accessible to any JavaScript running on your page, including malicious scripts injected through XSS vulnerabilities. Cookies with the httpOnly flag can only be accessed by the server, which makes them significantly harder to steal.

Implement proper session expiration and refresh token rotation. Long-lived tokens are convenient for users but represent a persistent security risk. A stolen token that expires in 15 minutes is a minor inconvenience. A stolen token that expires in 30 days is a potential disaster. Find the balance between security and user experience, then err on the side of security.

Building Your Security Feedback Loop

Security isn’t a destination. It’s an ongoing conversation between your application and the people trying to break it. Set up monitoring and logging that gives you visibility into potential attacks. Log failed authentication attempts, suspicious input patterns, and unusual API usage. This data becomes invaluable when investigating incidents or identifying attack trends.

Set up automated security scanning in your deployment pipeline. Tools like OWASP ZAP can run basic penetration tests against your running application. These scans won’t catch everything, but they’ll identify obvious issues like unprotected admin endpoints or missing security headers. Think of them as spell-check for security.

The most important habit you can develop is regular security reviews of your code. Not formal audits that require consultants and PowerPoint presentations, but routine examinations of how data flows through your application. Follow user input from entry point to database storage. Trace sensitive data from retrieval to display. Ask yourself: if I were trying to break this, where would I start?

Security vulnerability hunting becomes easier with practice, and the skills you develop will make you a better engineer overall. You’ll start thinking more systematically about edge cases and error conditions. You’ll develop a healthy paranoia about external dependencies. Most importantly, you’ll sleep better knowing that your application can survive contact with the real world. What vulnerability hunting techniques have worked for you, and what patterns do you see repeated across different technology stacks?

Database Performance: Where to Start When Your Queries Are Crying for Help

Why Your Database Feels Like It’s Running Through Molasses

After two decades of watching developers discover that their beautiful application suddenly takes thirty seconds to load a user dashboard, I can tell you that database performance problems follow predictable patterns. The good news is that most performance issues stem from a handful of common culprits that are surprisingly straightforward to identify and fix. The bad news is that by the time you notice the problem, your users have already noticed it too.

Before you start randomly adding indexes like you’re seasoning soup, take a step back. Database performance optimization is less about memorizing arcane configuration parameters and more about understanding how your data flows through the system. Think of your database as a very organized, very literal librarian who will find exactly what you ask for, but only if you ask nicely and give them the right tools to work with.

The most elegant solutions usually address the root cause rather than the symptoms. Sure, you could throw more RAM at the problem, but that’s like buying a faster car when the real issue is that you’re taking the scenic route through downtown during rush hour. Let’s explore where to focus your efforts for maximum impact with minimum complexity.

Indexing: Your Database’s GPS System

Indexes are probably the single most effective tool in your performance optimization toolkit, yet I regularly encounter production databases that treat them like an afterthought. An index is a roadmap that tells your database how to find data without scanning every single row. Without proper indexes, your database resorts to the digital equivalent of reading every book in the library to find the one paragraph you need.

Start with your most frequently executed queries and work backward to understand what indexes would help them. If you’re constantly looking up users by email address, create an index on that email column. If you’re filtering orders by date range and customer ID, consider a composite index that covers both columns. The key insight here is that indexes should match your query patterns, not your table structure.

Here’s where it gets interesting: indexes aren’t free. They consume storage space and slow down write operations because the database has to maintain them. I’ve seen systems grind to a halt because someone created indexes on every column “just in case.” Focus on the queries that actually matter to your application’s performance, and resist the urge to over-index. Your future self will thank you when you’re not debugging mysterious slowdowns caused by index maintenance overhead.

One practical tip that has saved me countless hours: most database systems provide query execution plans that show you exactly which indexes are being used. Learn to read these plans. They’re like X-rays for your queries, revealing exactly where the bottlenecks are hiding. If you see a full table scan on a table with millions of rows, you’ve found your smoking gun.

Query Optimization: Writing SQL That Doesn’t Hate You

Good SQL is like good prose: clear, purposeful, and free of unnecessary flourishes. The database optimizer is sophisticated, but it’s not psychic. It can only work with what you give it, and poorly written queries will sabotage even the best indexing strategy. I’ve watched developers spend hours tuning indexes when the real problem was a query that asked for everything when it only needed a small subset.

Start by examining your SELECT statements. Are you selecting columns you don’t actually use? That `SELECT *` might be convenient when you’re prototyping, but in production it’s like asking someone to read you the entire encyclopedia when you just want to know what year the pyramids were built. Be specific about what you need, and your database will reward you with faster query times and lower memory usage.

Pay special attention to WHERE clauses and JOIN conditions. These determine how much data your database has to examine to produce results. A query that joins three tables without proper WHERE conditions can easily examine millions of row combinations when it should only look at hundreds. Use EXPLAIN or similar tools in your database system to understand how many rows each step of your query is processing.

Subqueries deserve special mention because they’re often performance traps disguised as elegant solutions. While they can make your code more readable, nested subqueries frequently perform worse than their JOIN equivalents. When you find yourself writing a query with multiple levels of subqueries, step back and consider whether you can restructure it using JOINs instead.

Connection Management: Don’t Let Your Database Drown in Handshakes

Database connections are expensive to create and maintain, yet many applications treat them like disposable resources. Opening a new connection for every query is like calling a taxi for every city block you need to travel. It works, but it’s wildly inefficient and will eventually overwhelm your database server when you have any meaningful amount of traffic.

Connection pooling is your friend here. Instead of creating connections on demand, maintain a pool of reusable connections that your application can borrow and return. Most modern frameworks and database libraries provide connection pooling out of the box, but they often ship with conservative defaults that don’t match real-world usage patterns. Take the time to tune your pool size based on your application’s actual connection needs.

The magic number for pool size isn’t universal, but here’s a starting point: monitor your application under typical load and see how many concurrent database operations you actually need. Start with a pool size that matches this number, then adjust based on performance metrics. Too few connections and you’ll create bottlenecks. Too many and you’ll overwhelm your database with idle connections consuming resources.

One common mistake I see is applications that don’t properly release connections back to the pool. A single code path that fails to close a connection can slowly leak resources until your application can’t get new connections at all. Always use connection management patterns that guarantee cleanup, like try-with-resources blocks in Java or context managers in Python.

Monitoring: Measuring What Actually Matters

You cannot optimize what you do not measure, and most applications measure the wrong things when it comes to database performance. CPU and memory usage are important, but they’re lagging indicators. By the time these metrics spike, your users are already experiencing problems. Focus instead on query execution time, connection pool utilization, and slow query logs.

Set up monitoring for your slowest queries first. Every database system can log queries that exceed a certain execution time threshold. Start with something reasonable like 500 milliseconds, then gradually lower it as you optimize the obvious problems. These logs will quickly reveal which specific queries are consuming the most resources and where to focus your optimization efforts.

Don’t ignore the patterns hiding in your metrics. A query that takes 50 milliseconds isn’t normally a problem, but if it’s executed 10,000 times per minute, it’s consuming more total resources than a 5-second query that runs once per hour. Look for high-frequency queries that could benefit from optimization, even if their individual execution time seems reasonable.

Consider implementing application-level monitoring that tracks database performance from your code’s perspective. This gives you insights into connection acquisition time, total request duration, and how database performance affects your user experience. The database server might report that queries are fast, but if your application spends two seconds waiting to get a connection, that’s still a problem worth solving.

Database performance optimization is ongoing work. The techniques covered here will solve most common performance problems, but every application has unique characteristics that may require different approaches. Start with solid fundamentals: proper indexing, efficient queries, smart connection management, and comprehensive monitoring. Once you’ve mastered these basics, you’ll have the foundation and confidence to tackle more complex optimization challenges as they come up.

Apache Kafka: The Data Highway That Never Sleeps (And Why It’s About to Get Even Faster)

The Beast That Tamed the Data Deluge

Picture this: you’re running a system that processes millions of events per second, your databases are crying for mercy, and your message queues are backed up like traffic on the 405 during rush hour. This was the reality at LinkedIn circa 2010, which led to one of those rare open source projects that didn’t just solve a problem but fundamentally changed how we think about data movement. Apache Kafka emerged from this chaos not as yet another message broker, but as something more ambitious: a distributed streaming platform that could handle the kind of data volumes that would make traditional systems weep.

What makes Kafka genuinely different isn’t just its performance metrics, though they’re impressive enough. It’s the architectural philosophy behind every design decision. Unlike traditional message queues that delete messages after consumption, Kafka treats data as a durable, ordered log that multiple consumers can replay at their own pace. This shift from ephemeral messaging to persistent streaming unlocked patterns we didn’t even know we needed. Suddenly, the same data pipeline could feed real-time analytics, populate search indexes, trigger business workflows, and maintain audit trails without the usual choreography of complex ETL jobs.

The numbers tell part of the story. Netflix pushes over 8 million messages per second through Kafka. Uber processes trillions of messages daily. But the real signal here isn’t the scale, it’s the reliability. When you’re debugging a production incident at 3 AM and your monitoring system depends on Kafka to surface the telemetry that will save your bacon, you develop a deep appreciation for systems that just work. Kafka’s log-based architecture means that even when consumers fall behind or crash, the data waits patiently for them to catch up. No data loss, no complex recovery procedures, just resilient by design.

Under the Hood: Why Kafka Scales When Others Fold

The secret isn’t magic, it’s ruthless focus on fundamentals that most systems get wrong. Kafka’s creators made a bet that sequential disk I/O would outperform random access patterns, even with the rise of SSDs. This sounds counterintuitive until you realize that modern operating systems are incredibly good at prefetching sequential data and that network overhead often dwarfs storage latency anyway. By structuring everything as append-only logs and letting the OS handle caching, Kafka achieves throughput that makes traditional database-backed message queues look quaint.

The partitioning model deserves special attention because it’s where the rubber meets the road for horizontal scaling. Each topic gets divided into partitions, and each partition maintains total ordering within itself while allowing parallel processing across partitions. This is elegant in its simplicity but requires careful thought about partition keys. Get it right, and you can add brokers to scale linearly. Get it wrong, and you’ll have hot partitions that bottleneck your entire pipeline while other partitions sit idle.

Consumer groups add another layer of sophistication that’s easy to overlook but important for real-world deployments. Multiple consumers can coordinate to process partitions in parallel, with automatic rebalancing when consumers join or leave the group. This isn’t just convenient for operations; it enables patterns like blue-green deployments for streaming applications. You can spin up a new version of your consumer application, let it join the consumer group, verify it’s processing correctly, then gracefully shut down the old version. Zero downtime deployments for streaming workloads used to require custom tooling and prayer. Now it’s built into the platform.

The Streaming Revolution: Beyond Simple Messaging

Here’s where things get interesting from a forecasting perspective. Kafka started as a better message broker, but it’s evolving into something more fundamental: the nervous system for data-driven organizations. Kafka Streams, introduced in 2016, lets you build sophisticated stream processing applications using familiar programming models rather than specialized frameworks. Instead of shuttling data between Kafka and external stream processors, you can perform windowed aggregations, joins, and transformations directly within the Kafka ecosystem.

The implications ripple outward in ways that are still unfolding. Traditional batch processing architectures are giving way to streaming-first designs where data flows continuously rather than in scheduled chunks. This shift enables near real-time decision making that was previously impossible or prohibitively expensive. Fraud detection systems can now flag suspicious transactions within milliseconds of occurrence. Recommendation engines can update user profiles as behavior happens rather than waiting for overnight batch jobs. Supply chain systems can react to disruptions as they propagate rather than discovering them in morning reports.

What’s particularly compelling is how this streaming model aligns with modern application architectures. Microservices naturally generate events as they process requests, and Kafka provides the infrastructure to turn these events into valuable business insights. Event sourcing patterns, where you store events rather than current state, become practical at scale when you have a platform designed for infinite event retention. The database stops being the authoritative source of truth and becomes just another view materialized from the event stream.

Reading the Tea Leaves: Where Kafka Is Heading

The roadmap signals from the Kafka community point toward three major evolution vectors that will likely reshape how we build distributed systems. First, the ongoing work on tiered storage will fundamentally change the economics of long-term data retention. Currently, keeping months or years of data in Kafka requires expensive local storage on every broker. The new architecture will automatically move older data to cheaper object storage while maintaining the same consumer APIs. This isn’t just a cost optimization; it enables entirely new use cases where you can replay years of historical data for model training or compliance auditing.

The second major thrust is around operational simplicity through self-managing clusters. KRaft mode, which eliminates the ZooKeeper dependency, is already rolling out and will become the default deployment model. But the more interesting development is the push toward automated partition management, dynamic scaling, and intelligent resource allocation. The vision here is Kafka clusters that adapt to workload patterns without human intervention, scaling partitions based on throughput, rebalancing data across brokers as capacity changes, and optimizing resource allocation based on access patterns.

The third vector, and perhaps the most speculative, involves tighter integration with modern data platforms and AI workloads. As organizations build more sophisticated machine learning pipelines, the boundary between streaming data platforms and ML infrastructure is blurring. Kafka’s role is expanding from data transport to feature serving, where real-time features computed from streaming data feed directly into model inference pipelines. The emergence of streaming SQL interfaces and integration with lakehouse architectures suggests Kafka is positioning itself as the bridge between operational data systems and analytical workloads.

The Signal in the Noise

After watching enough technology cycles, you develop a sense for what’s sustainable innovation versus what’s just shiny object syndrome. Kafka is the former because it solved real problems that weren’t going away: how to move data reliably at scale, how to build systems that stay responsive under load, and how to maintain consistency in distributed architectures without sacrificing performance. The fact that it’s becoming more capable rather than more complex is a strong signal that the core abstractions are sound.

The ecosystem growth tells another part of the story. When you see major cloud providers offering fully managed Kafka services, database vendors building Kafka-compatible interfaces, and streaming frameworks standardizing on Kafka protocols, you’re witnessing infrastructure consolidation around a winning architecture. This isn’t vendor lock-in; it’s the market recognizing that certain patterns work well enough to become foundational.

For engineers building systems today, the question isn’t whether to use Kafka but how to use it thoughtfully. The technology has matured past the early adopter phase where you needed deep expertise to run it reliably. Modern managed offerings handle the operational complexity while preserving the architectural benefits. What matters now is understanding which patterns fit your use case and designing data flows that will scale with your organization’s growth. Building systems that can handle continuous data streams gracefully is becoming table stakes, and Kafka has proven it can be that foundation layer that everything else builds upon.

Have you encountered interesting Kafka use cases in your own systems, or are you wrestling with streaming architecture decisions? The patterns that emerge from real-world deployments often reveal insights that don’t make it into the documentation, and I’d be curious to hear what you’ve discovered in the trenches.

The Coming Wave: How AI Will Reshape Cloud Cost Optimization (And Why Your CFO Should Care)

The Signal in the Noise: Why This Time Really Is Different

I’ve watched three major waves of cloud cost optimization tooling over the past decade. First came the basic monitoring dashboards that told you how much you were spending after the damage was done. Then the rightsizing recommendations that assumed your workloads were predictable and your teams actually read Slack notifications. Most recently, we got the policy engines that let you pretend governance would solve what is fundamentally a cultural problem.

But something genuinely different is happening now, and it’s not just another vendor promising to cut your AWS bill by 30%. The combination of mature machine learning models, granular telemetry data, and increasingly sophisticated infrastructure APIs is creating optimization capabilities that would have seemed like science fiction when I was manually resizing EC2 instances in 2015.

The signal here isn’t just better cost reporting. It’s predictive optimization that can anticipate demand patterns weeks in advance, automatically negotiate reserved capacity across multiple cloud providers, and make real-time workload placement decisions based on cost, performance, and availability requirements simultaneously. This isn’t speculation anymore. The foundational pieces are already in production at organizations sophisticated enough to build rather than buy their optimization stack.

Autonomous Infrastructure: Beyond Reactive Cost Management

The most compelling development I’m tracking is the emergence of truly autonomous infrastructure optimization. Current tools react to what happened yesterday or last week. The next generation predicts what will happen next month and takes action today. We’re seeing early implementations that combine historical usage patterns, business cycle data, and external signals like seasonality or market events to make infrastructure decisions with superhuman accuracy.

Consider what becomes possible when your optimization system understands that your e-commerce workload will spike 300% next Friday because of a planned marketing campaign, can predict that spot instance pricing will be favorable in us-east-1 but volatile in eu-west-1, and automatically pre-provisions the optimal mix of instance types across regions. This isn’t theoretical anymore. Teams at organizations like Netflix and Uber have been building versions of this capability for years, but the barrier to entry is dropping rapidly.

The really exciting part is cross-cloud intelligence. As multi-cloud becomes the default rather than an aspiration, optimization systems that can arbitrage workloads between AWS, Azure, and GCP in real-time will deliver advantages that dwarf traditional reserved instance strategies. Early movers are already seeing 40-60% cost reductions on compute-heavy workloads through intelligent placement algorithms.

What makes this autonomous approach fundamentally different is the feedback loop. These systems don’t just optimize for cost in isolation. They’re learning to balance cost against performance, reliability, and business outcomes in ways that manual processes simply cannot match at scale.

The Data Revolution: Why Observability Finally Enables True Optimization

Here’s where my inner data nerd gets genuinely excited. The observability explosion of the past five years hasn’t just given us better debugging tools. It’s created the data foundation that makes sophisticated cost optimization possible for the first time.

Modern telemetry platforms are collecting resource utilization data at sub-second granularity across entire application stacks. When you combine this with business metrics, user behavior patterns, and cost attribution data, you get a complete picture of value creation that was impossible before. We’re not just optimizing infrastructure anymore. We’re optimizing the relationship between infrastructure spend and business outcomes.

The breakthrough insight is that cost optimization can’t be separated from performance optimization. The most effective systems I’m seeing treat them as a unified problem space. They understand which workloads are revenue-critical and which are cost centers, which users generate the highest lifetime value, and how infrastructure decisions impact conversion rates or customer satisfaction scores.

Machine learning models trained on this rich dataset can identify optimization opportunities that human operators miss consistently. They spot patterns like “customer support ticket volume correlates with database query latency, which increases when we rightsize our database instances too aggressively.” These complex trade-offs are where the real optimization gains live, and they’re only accessible through systematic data analysis at scale.

Implementation Reality: What You Can Actually Build Today

The gap between what’s possible in theory and what you can implement next quarter is narrower than you might think, but it requires honesty about where you are in the maturity curve. Most organizations are still struggling with basic cost visibility and allocation. You can’t optimize what you can’t measure accurately.

Start with the fundamentals that enable everything else. Implement comprehensive tagging strategies that tie resources to business units, applications, and cost centers. Establish automated rightsizing for obvious wins, but don’t expect this alone to solve your cost challenges. Build or buy tooling that provides real-time cost attribution and alerts before you’re building machine learning models.

The middle tier of maturity involves predictive scaling based on historical patterns, intelligent reserved instance planning that considers your actual usage patterns rather than vendor recommendations, and automated policy enforcement that prevents the most expensive mistakes. These capabilities are available today through vendors like Spot.io, CloudHealth, or custom implementations using cloud-native services.

For teams ready to push the envelope, the advanced tier includes cross-cloud workload placement, ML-driven capacity planning, and optimization systems that incorporate business context into infrastructure decisions. This is where you’ll find the most significant competitive advantages, but it requires substantial engineering investment and data infrastructure maturity.

The Strategic Shift: From Cost Center to Competitive Advantage

The organizations that figure this out first will fundamentally reshape competitive dynamics in their industries. When your infrastructure cost per customer is 50% lower than your competitors while delivering superior performance and reliability, you’re not just optimizing costs anymore. You’re creating sustainable competitive advantages.

This strategic dimension is why forward-thinking CFOs are starting to view cloud optimization as a core capability rather than a necessary evil. The same systems that reduce infrastructure costs can enable entirely new business models, support more aggressive pricing strategies, and provide operational leverage that scales with growth rather than creating bottlenecks.

The timeline for this transformation is compressed. Early implementations of autonomous optimization are already delivering results, and the tooling ecosystem is maturing rapidly. Organizations that wait for complete solutions to emerge will find themselves competing against teams that have been iterating on these capabilities for years.

I’m curious about your experiences with advanced cost optimization approaches. Are you seeing similar patterns in your infrastructure? What optimization challenges are you tackling that might benefit from these emerging approaches? The most interesting developments are happening at the intersection of cost optimization and business strategy, and I’d love to hear how teams are thinking about this evolution.

Stop Building APIs Like It’s Still 2015: A Reality Check on Modern Design Patterns

The REST Orthodoxy Is Making Your API Worse

We need to talk about REST. Not the philosophical ideal of REST that Roy Fielding described in his dissertation, but the cargo-cult version that most teams implement. You know the one: slap HTTP verbs on everything, call it RESTful, and ship it. I’ve spent the last decade watching teams contort themselves into pretzels trying to force every operation into GET/POST/PUT/DELETE, creating APIs that are technically RESTful but practically useless.

Stop Building APIs Like It's Still 2015: A Reality Check on Modern Design Patterns
Stop Building APIs Like It’s Still 2015: A Reality Check on Modern Design Patterns

The real problem isn’t REST itself. It’s the religious adherence to REST principles even when they don’t fit your use case. Take batch operations. I’ve seen APIs that require 47 individual DELETE requests to clean up a user’s data because “that’s the RESTful way.” Meanwhile, your mobile app times out, your database connection pool explodes, and your users wonder why your competitor’s app feels so much snappier.

Modern API design recognizes that different problems need different solutions. GraphQL handles complex data fetching elegantly. gRPC excels at high-performance service-to-service communication. Even good old RPC-style endpoints can be the right choice for operations that don’t map cleanly to resource manipulation. The best APIs I’ve worked with in the last few years use REST as a starting point, not a straightjacket.

Your Error Handling Is Probably Terrible

Let’s conduct a quick audit. When your API returns a 400 Bad Request, what information does the client actually get? If the answer is a generic error message that could apply to any validation failure, you’re doing it wrong. I’ve debugged too many integration issues where the only clue was “Invalid input” and a prayer to the logging gods.

Good error handling follows a simple principle: give developers exactly what they need to fix the problem without exposing internal implementation details. This means structured error responses with specific error codes, clear descriptions, and actionable guidance. When a required field is missing, tell them which field. When a value is out of range, tell them the valid range. When rate limiting kicks in, tell them when they can try again.

The RFC 7807 Problem Details specification provides a solid foundation, but don’t treat it as gospel. What matters is consistency across your API and usefulness to your consumers. I’ve seen teams spend weeks arguing over the perfect error schema while their API returns HTTP 200 with error messages buried in JSON. Perfect is the enemy of good, but good is still better than whatever that is.

Pagination: Where Good Intentions Go to Die

Here’s a fun exercise: count how many different pagination schemes you’ve encountered in the last year. Offset-based, cursor-based, page-based, limit-skip, next-previous tokens. The pagination world looks like a standards committee explosion, and most implementations have subtle bugs that only surface when someone actually tries to paginate through large datasets.

Offset-based pagination feels intuitive but breaks down at scale. Ever notice how Google search results get weird after page 20? That’s because offset pagination becomes expensive and inconsistent as you go deeper into large datasets. Meanwhile, your API is probably using OFFSET/LIMIT queries that get slower with each page and can return duplicate results if data changes during pagination.

Cursor-based pagination solves the performance problem but creates a usability problem. Clients can’t jump to arbitrary pages, can’t show meaningful progress indicators, and debugging becomes harder when cursors are opaque tokens. The solution isn’t to pick one approach and use it everywhere. Design your pagination strategy based on how your API actually gets used. Real-time feeds need cursor pagination. Administrative interfaces often need offset pagination. Some endpoints need both.

The Versioning Trap Everyone Falls Into

API versioning strategies generate more heated debates than text editors, and most of them miss the fundamental point. Versioning isn’t about picking the perfect scheme. It’s about minimizing the pain of change for both API providers and consumers. Yet teams regularly choose versioning approaches that maximize complexity while providing minimal flexibility.

URL versioning (/v1/users) is visible and explicit but couples versioning to routing infrastructure. Header versioning keeps URLs clean but makes testing and debugging harder. Media type versioning is theoretically elegant but practically ignored by most tooling. Each approach has genuine trade-offs, but the choice matters less than having a clear deprecation policy and migration path.

The real versioning trap is thinking you can avoid breaking changes through clever design. You can’t. Requirements evolve, security issues surface, and performance constraints force architectural changes. The APIs that age well plan for change from the beginning. They use explicit contracts, maintain backward compatibility where possible, and communicate breaking changes clearly with sufficient lead time.

Authentication: Beyond the Bearer Token Cargo Cult

Every API tutorial starts with JWT bearer tokens, so every API ends up using JWT bearer tokens. Never mind that JWTs are stateless tokens optimized for distributed systems, while your monolithic API could benefit from simple session tokens with server-side revocation. Never mind that storing sensitive claims in JWTs creates security risks that most teams don’t understand.

The choice between different authentication schemes should be driven by your actual requirements, not by what’s trendy. Do you need single sign-on across multiple services? JWTs make sense. Do you need fine-grained permission revocation? Server-side sessions are simpler. Do you have mobile clients with intermittent connectivity? Consider the token refresh workflow carefully.

More importantly, authentication is just the first step. Authorization is where most APIs fall apart. Role-based access control sounds simple until you have 47 different roles and nobody remembers what the “content_moderator_regional” role actually does. Attribute-based access control is theoretically powerful but practically complex to implement and debug. The authorization scheme that works is the one your team can reason about correctly under pressure at 3 AM.

What patterns have you seen work well in practice? I’m particularly interested in how teams handle the inevitable evolution from simple authentication to complex authorization requirements without rewriting everything. The comment section is open, and unlike most APIs, it actually works reliably.

The IDE Landscape in 2026: Why Your Choice of Development Environment Could Make or Break Your Career

The Microsoft Monopoly: VS Code’s Stranglehold on Web Development

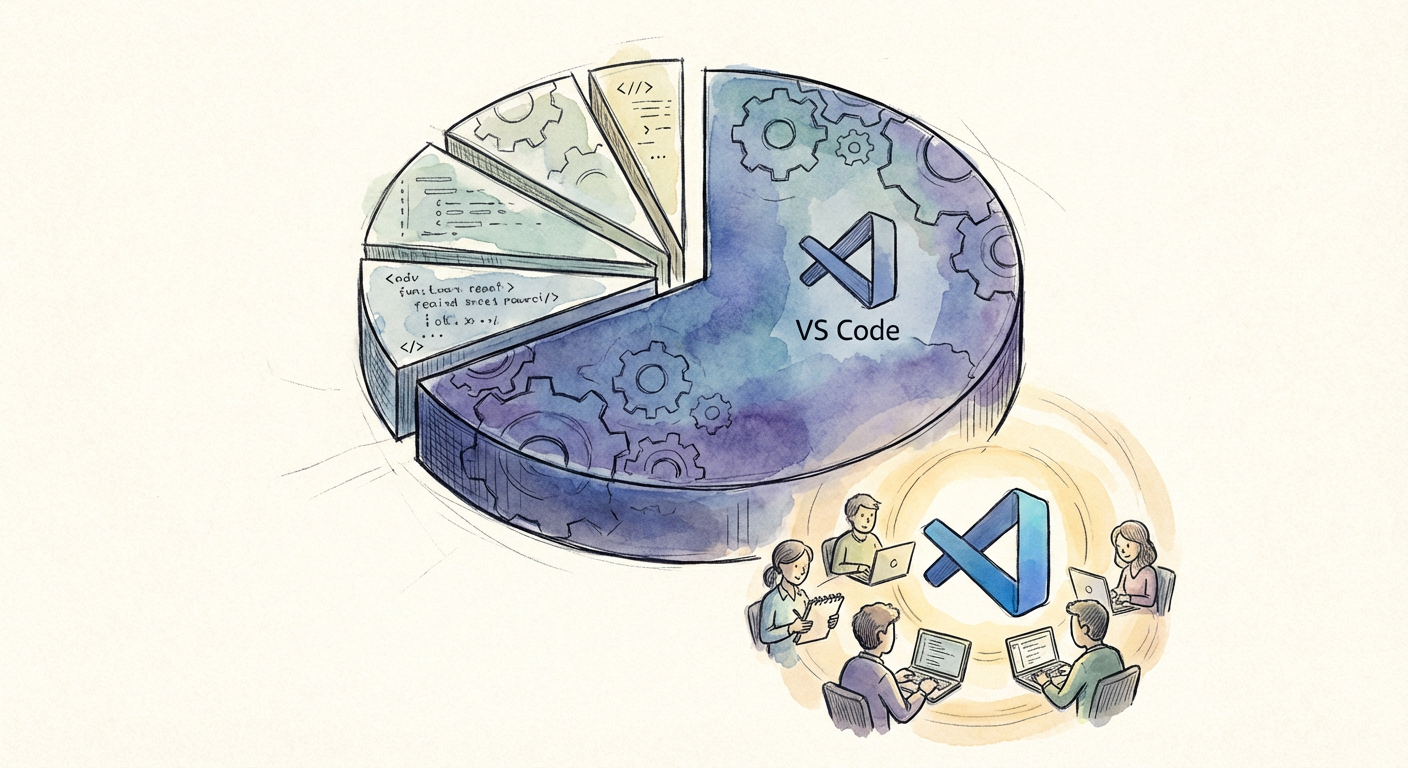
Microsoft’s Visual Studio Code has pulled off something pretty incredible in the development tools space. More than seven out of ten web developers now use VS Code as their primary environment. It’s basically the default choice for frontend and full-stack development. This didn’t happen by accident. Microsoft made VS Code the Swiss Army knife of development environments, simple enough for beginners but extensible enough to satisfy power users.

The IDE Landscape in 2026: Why Your Choice of Development Environment Could Make or Break Your Career

For developers building their careers, this market concentration has some upsides and downsides. Sure, mastering VS Code means you’ll be productive in most web development teams from day one. The VS Code documentation and ecosystem knowledge you build transfers easily between companies and projects. But there’s a risk here too. When you tie your productivity to one company’s strategic decisions, you’re betting everything on Microsoft’s vision for development tools.

The smart career move isn’t avoiding VS Code entirely. Instead, understand why it won. Study its extension model, learn how it balances simplicity with power, and recognize the patterns that made it successful. These insights will help you regardless of which tools dominate the next decade.

Illustration for The IDE Landscape in 2026: Why Your Choice of Development Environment Could Make or Break Your Career

Enterprise Fortresses: Where JetBrains Still Rules Supreme

While Microsoft conquered web development, JetBrains kept its grip on enterprise development, particularly in Java and Kotlin ecosystems. IntelliJ IDEA, WebStorm, and their suite of specialized IDEs remain the go-to tools for teams building large-scale applications in corporate environments. This isn’t just about preference. It’s about the sophisticated refactoring tools, deep code analysis, and integrated debugging that become essential when working with complex codebases.

The JetBrains developer survey consistently shows that developers using their tools report higher productivity in enterprise contexts. For career-minded developers, this creates an interesting choice. Learning JetBrains tools opens doors to higher-paying enterprise positions, particularly in financial services, healthcare, and other regulated industries where robustness matters more than rapid prototyping.

The investment in JetBrains expertise pays long-term dividends because these tools evolve with enterprise needs. As companies modernize legacy systems and adopt new JVM languages, developers who understand these sophisticated development environments become increasingly valuable.

The Performance Revolution: Zed and the Speed-First Movement

A new generation of developers is rejecting the complexity of traditional IDEs for tools that prioritize raw performance. Zed, built from the ground up with Rust, represents this shift toward editors that can handle massive codebases without the lag and memory consumption that plague Electron-based tools. Performance-conscious developers, particularly those working with large monorepos or resource-constrained environments, are gravitating toward these lightweight alternatives.

This trend matters for career development because it reflects broader industry movements. As applications grow more complex and teams scale globally, the ability to work efficiently with large codebases becomes a differentiating skill. Developers who understand performance-focused toolchains often find themselves leading optimization efforts and architectural decisions.

The Zed phenomenon also highlights the importance of staying curious about emerging tools. Early adopters of performance-focused editors often become the internal evangelists who drive tool adoption across their organizations. This technical leadership role can accelerate career growth significantly.

AI Integration: How Copilot and Cursor Are Reshaping Code Review Culture

Artificial intelligence has fundamentally changed how developers write and review code. Tools like GitHub Copilot and the AI-powered Cursor editor have moved beyond simple autocomplete to become active pair programming partners. This shift is creating new expectations around code quality, review processes, and developer productivity that every career-focused developer must understand.

The integration of AI into development workflows is changing what senior developers value in junior colleagues. The ability to effectively prompt AI tools, review AI-generated code critically, and maintain coding standards despite AI assistance has become a core skill. Developers who master this balance between AI leverage and human oversight find themselves in high demand.

More importantly, AI-powered development tools are creating a new tier of productivity expectations. Teams using these tools effectively can ship features faster and with fewer bugs. Developers who resist AI integration risk being seen as productivity bottlenecks, while those who embrace it thoughtfully position themselves as force multipliers within their organizations.

The Terminal Renaissance: Neovim and the Command Line Comeback

While GUI tools have dominated development for decades, a significant segment of developers is returning to terminal-based workflows. Neovim’s plugin ecosystem has exploded, creating development environments that rival traditional IDEs in functionality while maintaining the speed and flexibility that made Vim legendary. This isn’t nostalgia driving the trend, but a practical response to the complexity of modern development workflows.

Terminal-first developers often demonstrate higher proficiency with DevOps tools, command-line utilities, and server administration. These skills translate directly to higher compensation in infrastructure-focused roles. Companies building cloud-native applications particularly value developers who can move easily between coding and operations tasks.

The career advantage of terminal fluency extends beyond individual productivity. Developers comfortable with command-line workflows often become the go-to people for debugging production issues, setting up CI/CD pipelines, and automating repetitive tasks. These problem-solving roles naturally lead to senior technical positions.

The Low-Code Threat: Preparing for a Changing Job Market

Perhaps the most significant long-term challenge facing developers isn’t choosing between IDEs, but adapting to the rise of low-code and no-code platforms that are reshaping entry-level development work. These platforms are handling an increasing share of simple web development, data transformation, and business automation tasks that traditionally provided entry points into programming careers.

Smart developers are responding by moving up the complexity stack. Instead of competing with drag-and-drop interfaces for basic CRUD applications, successful developers focus on system design, performance optimization, security implementation, and the complex integrations that low-code platforms can’t handle. Your choice of development tools should support this upward mobility.

The developers thriving in this environment understand both traditional programming and modern low-code platforms. They can architect solutions that leverage the best of both worlds, using low-code tools for rapid prototyping and traditional development for complex logic. This hybrid approach requires comfort with multiple development environments and the judgment to choose the right tool for each task.

The IDE wars of 2026 aren’t really about which editor has the best syntax highlighting or debugging features. They’re about choosing tools that align with your career trajectory and the evolving demands of software development. Whether you standardize on VS Code for its ubiquity, invest in JetBrains for enterprise opportunities, explore Zed for performance gains, or master terminal-based workflows for infrastructure roles, the key is understanding how your toolchain choices support your professional goals. What development environment challenges are you facing in your current role, and how might different tool choices open new opportunities?